We would like to use the interpolation type “curveStepAfter” for our Powerchart. To achieve a true curveStepAfter visualization, we need to set the “pointCount” parameter to -1.
However, when we set pointCount = -1, we encounter performance issues when loading data over longer time periods, since all of that data needs to be loaded into the browser at once.
Is there a way to preserve the true curveStepAfter interpolation behavior while avoiding the limitations caused by loading large amounts of data?
Consider using tall output format if displaying multiple pens, and post-processing in private custom properties. Non-private custom properties are sent to the browser even if not used there.
What’s the date type of the tag? If you’re expecting it to be stepping, then it should be one of the integer types (Integer, Short, Long depending on the data range). Sometimes, OPC tags can still come in as Float/Double, but you can still force it to be an integer type in Ignition.
Alternatively, I think you can also change the Deadband Style to Discrete under the tag’s History config
I've reviewed the Perspective Power Chart documentation but cannot find a setting to choose between tall and wide output formats. Users currently select their own pens, which populates the pens[x].data.source field with the historical tag path.
The tall/wide output format option appears to be available only for Tag History Bindings and the system.tag.queryTagHistory scripting function, not directly on the Power Chart component itself. Could you clarify where this option is available?
This is an interesting optimization point. Could you elaborate further? We have several custom tag properties, and understanding how to leverage private custom properties for post-processing would be interesting for reducing data transmission.
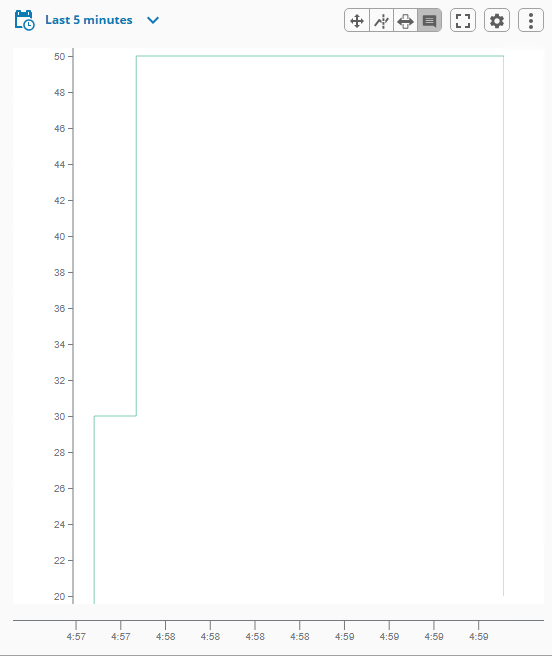
Most of our tags are Float. We have several tags that increase approximately linearly over time, but once they reach a certain value, they remain exactly at that value for about 2 hours. After the next OPC tag read, the value resets to its minimum. Since there are no tag value changes during this plateau, no new entries are written to the historian (which is the desired behavior), but this causes improper visualization with incorrect interpolation applied (e.g. not having the pointCount = -1 and pens[x].display.interpolation = curveStepAfter). I've attempted to illustrate this below:
We could experiment with this approach, although I understand it primarily affects the logic behind how values are recorded rather than how they're visualized in the Power Chart component.
I have been having the same issue for a long time. My tag Deadband Style property is set to discrete and the pen style in the chart is curveStepAfter. Any advice? This has been a major problem for all my users for a long time. We were able to fix it in Vision’s Easy Chart, but not Perspective’s Power Chart.