Hello,
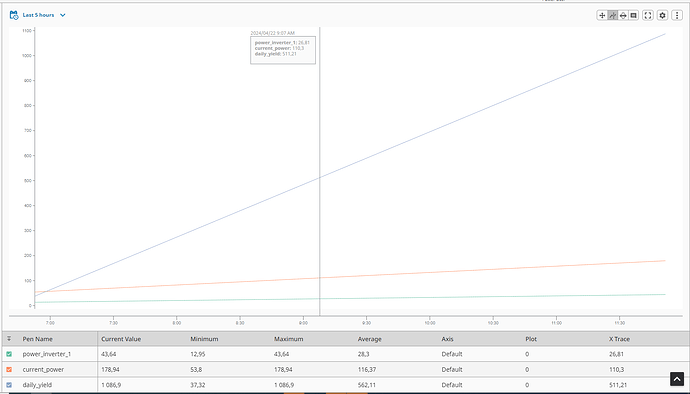
I have a problem with the Power Chart using Remote History Provider. When I set the chart range to less than 4 hours, the chart draws correctly. When I increase the range to more than 4 hours, then a straight line is drawn on the graph connecting the two points. I use many remote historical providers in the project and the problem occurs only for one of them. What could be the reason for this problem?
Range 4 hours:
Range 5 hours:

