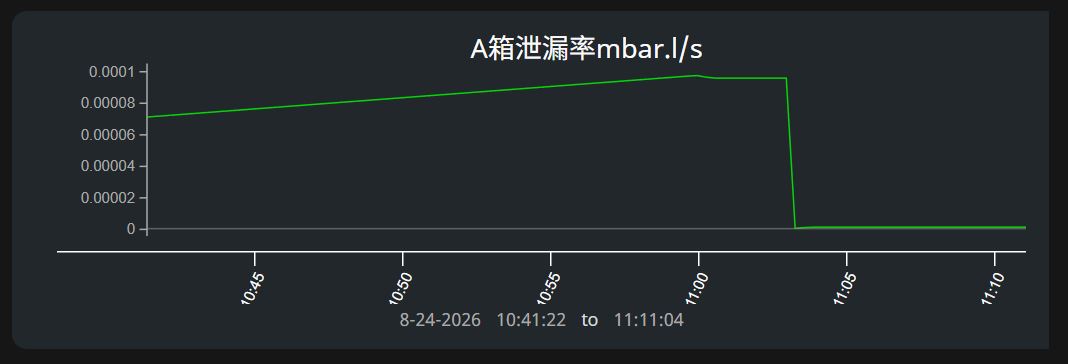
Yes, it's possible. In the Property Editor on your Power Chart, you want to create an axis, give it a name, and set the tick.label property to "e". Make sure to select that axis for your pen, as well.
You can tweak the number of digits and such. Ignition is using the D3 syntax: d3-format

Thanks for your help!