Hello
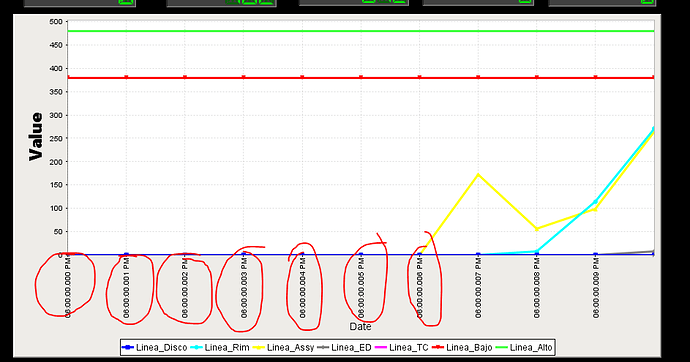
I do a chart but I have a problen whit the X Axis, in my Dataset Table I see the data ok but in the chart in the X axis is diferent
example
in my dataset from 0 to 10 but in the X axis from 6:00:00:000 to 6:00:00:010 , I don’t know whit put the 6:00:00


