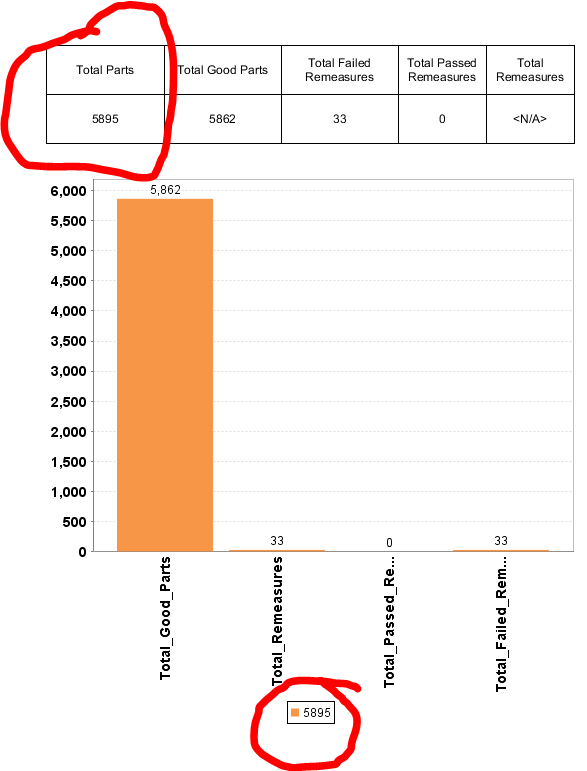
My bar graph in my report is using most of my data to populate the bars of the graph (as it should) but then it leaves out one column from my named query that I want displayed and it puts the value in the graph legend. Why does it do this? I just want it to use all my (5) columns from my query as 5 bars displaying data.