Hi all –
I’m working on a production report for a client and I’m running into a challenge with campaign-level summaries.
Context
-
Main data source is a Named Query (MainQueryDetails) that returns all fields I need: Work Order, Campaign, Product, Line, Batch Number, Ingredient, Target, Actual, etc.
-
My grouping hierarchy in the report:
- Work Order
- Campaign
- Product
- Line
- Batch Number
- MainQueryDetails (all data)
Current Behavior
-
Each batch group lists all ingredients and their amounts.
-
A batch group footer calculates per-batch ingredient totals (works fine).
-
The Campaign group footer can show a single aggregated record (total usage for all ingredients combined), but not multiple rows per ingredient.
Goal
After each campaign, I would like a summary table that:
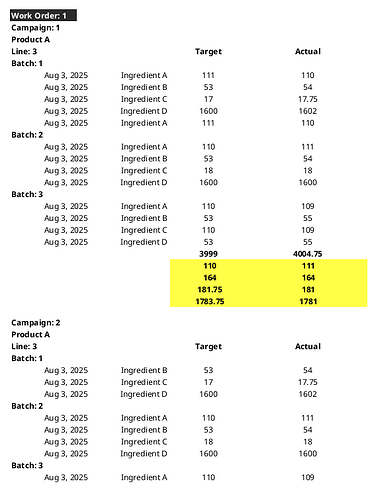
What I am trying to accomplish is the highlighted summary of each campaign in the attached mockup. I currently have all the other parts working with a single table group and then grouping previously mentioned.
First thing I would ask, why not add sum target and sum actual columns to the batch groupings. You already have the ingredients listed there, why repeat those lines again?
Edit: I missed the part where the sums include all batches under a campaign, but I think it could still work. Can you supply an example dataset?
It would look something like this with multiple shop orders and campaigns present. Like I said, I can put a summary row on the campaign group which totals all ingredients for the entire campaign, but I can’t detail out the campaigns totals for each ingredient. I can always add another table at the end of the report that has totals of each ingredient grouped by campaign only, but I was trying to make the report more streamlined.
Can you post a csv or something that I can copy/paste?
I see what you mean by not being able to get multiple rows for your ingredient summation lines.
I think the only way you can do this is to add the summary for the appropriate group (line I think), then make that row unstructured. Then you can add another table inside that summary row to get multiple lines. Note that the space used for this row won’t be dynamic in height.
You’ll have to figure out how to manipulate your data, or add window functions to your query, and or subquery your data to get the ingredient totals you need to populate the tables.
Hey Daniel,
Thanks for sharing this info. I wanted to give an update on my progress. I tried the nested table approach you suggested, and I thought it was going to work, but I couldn’t quite get it to completely work.
I nested a table inside the campaign group’s summary row and pointed it to the same dataset. Then I grouped that nested table by ingredient, which does correctly summarize and list each ingredient’s target and actual values.
The issue is that it repeats every campaign’s ingredient summary for each campaign, instead of only showing the ingredient summary for the campaign it’s nested under. I had assumed the initial campaign grouping would automatically limit the nested table’s data, but that isn’t the case.
I also tried creating a nested query specifically for that nested table, but haven’t had much luck with it yet.
I would either add another query to the data source that sums up the totals for the ingredients by campaign and work order, or do a scripted data source and do it manually in a loop.
1 Like
I thought about another query that does totals by campaign (this is easy to do), but how does the nested table know not to list all the campaign’s ingredient totals after each main table’s grouped campaign?
Put it in the campaign footer?
I believe this what I tried previously. The nested table doesn’t know to only show summed ingredients for the campaign group it is in.
Without seeing the actual data sources for the report, but if you do an actual subquery in the data sources that is linked by campaign, it should then be nested right into the tables based off of campaign ID?
Off the top of my head, no designer open at the moment but.
The subquery just doing a sum of ingredients for the campaign grouped by however deep you want to go with it.
SELECT [Campaign],[Product],[Line],[Ingredient], SUM(Actual) as TTL
FROM MainTable
WHERE Campaign = ?
GROUP BY [Campaign],[Product],[Line]
And link the parameter to {Campaign}


