I need some help creating a report. This report will create labels for all electrical boxes on a given machine. The source of this data resides in three tables. Below is the data I want on the form.
Jboxes
Equipment
Description
Location
JBoxCode
Sources (Links to JBoxCode above)
JBoxCode
Description
Voltage
LockoutPoint
LockoutPoints (Links to LockoutPoint above)
LockoutPoint
LockoutName
LockoutPointLocation
Each Jbox has several sources and each source has a lockout point.
I can create a report with the label shape but I get repeating data. What I want is:
For each JBox; list the sources and lockout points. Can I create a report like this in the designer?
Here is the query if all the data is in one dataset.
[code]SELECT
LockOutJBoxes.Line,
LockOutJBoxes.Description AS JBoxDescription,
LockOutJBoxes.Equipment,
LockOutJBoxes.Location,
LockOutJBoxes.JBoxCode,
LockOutEnergySources.V,
LockOutEnergySources.Description AS EnergyDescription,
LockOutEnergySources.LockoutPoint,
LockOutPoints.LockOutPointID,
LockOutPoints.LockOutName,
LockOutPoints.LockOutPointLocation,
LockOutPoints.LockOutDevice
FROM LockOutJBoxes
INNER JOIN
LockOutEnergySources ON LockOutJBoxes.JBoxCode = LockOutEnergySources.JBoxCode
INNER JOIN
LockOutPoints ON LockOutPoints.LockOutPointID = LockOutEnergySources.LockoutPoint
[/code]
I also tried having a dataset for each table but I cannot figure out how to do the linking on the designer.
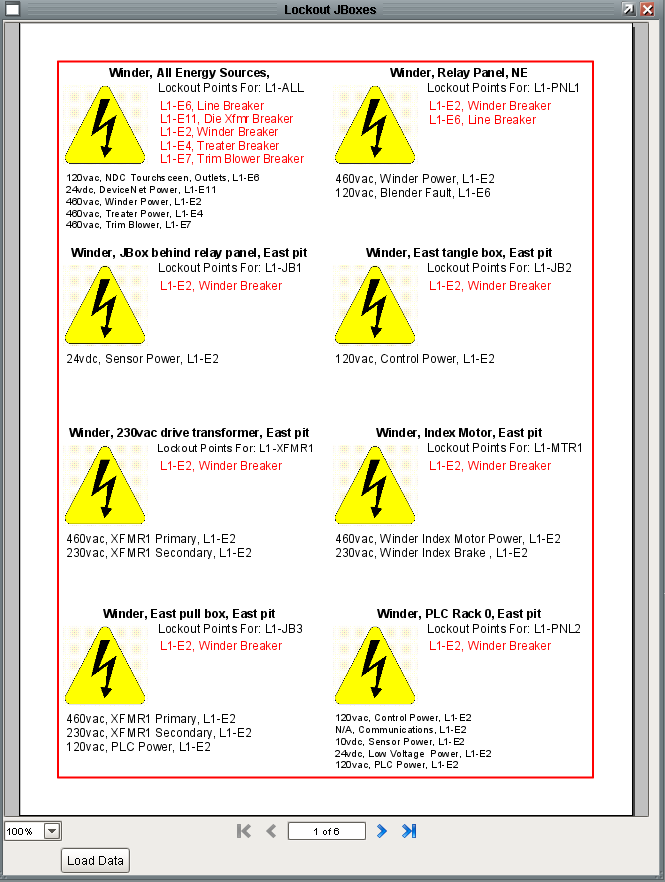
Attached is a FPMI screen shot of an what it should look like.
Can you run that query on a table in a window so that it fills up with realistic sample data, export the window, and post it here? That would help us figure out the best way to make that report.
I only have data for one machine on one line. I am still developing this so I can implement any suggestions without affecting any users.
Attached is a window containing all the data.
Thank you for looking at this. LockoutSampleData.fwin (62.6 KB)
If you have Excel, i have an easy solution for you. You can make your reporting in Excel using OPC. Checkout this product, it’s fully functional for 30 days: matrikonanalytics.com/produc … orter.aspx
The only thing about the sample label that you showed was the fact that the voltage sources, which are really a detail record of the lockout points, are shown separately, and the correlation between the two is done by the user via the IDs. This runs against the grain with how the reporting plugin wants to show the data, which is by visually correlating the relationship between the voltage sources and the lockout points.
The most natural way to do this with our reporting plugin would be to have each label look like this. Obviously don’t get hung up on the visual style (missing image, etc), just concentrate on the reorganization of the data. Let me know if this works for you. If not, I think we can get it to look the other way, but it is going to be much more involved…
You know… I tried for hours to try to get it to show the right data (in any format) and am at a loss on how you did this. Could you post or send me the report so I can see how this is done.?
I organized the data the way I did because I am trying to make the label as small as possible. There is alot of flexibility here. I will try this and see if it will work.
BTW: The help file was giving me an error whenever I tried to show information about filter expressions.
Heh, and here I was racking my brain to get it to look exactly like your example.
Getting the report to look like my screenshot is really quite simple with the merged dataset that you provided. You just make a table, and add the JBoxCode and LockoutPointID to the grouping. This makes the reporting component break up the code into each unique JBox, and for each JBox, each unique LockoutPoint. After that its just a matter of filling in the details.
I printed the report and I will not be able to use it for a label but I do like it for a report to give to my manager.
I was trying to get everything to work using the label control. Some of the boxes I have to label are fairly small. Can this be done using the custom label say 2 columns by 6 rows?
Don’t worry about organization I will mess with that once I am able to get the data on each label.
Ok, well when in doubt - you’ve always got scripting! I just used a little python to massage your merged input dataset on the fly into the format you want, which has the voltage sources concatenated together separate from the lockouts. You can mess with the formatting to get it to match, but the format is exactly like your original screenshot. In this window, the input dataset is on the root container, and then a property change script massages the dataset when it changes and pushes it into the report.
BTW - if you need better turn around on stuff like this, you should consider purchasing a few hours of Design Consultation. Lockout_LabelReport.fwin (47.4 KB)
Carl,
Thank you very much for the script! I had a mental block because I couldn’t figure out how to script within the reporting plugin so I was trying to massage the data within the query. I never thought about using scripting to massage the data before it gets to the report.
I want to apologize if I seemed impatient. My frustration was with my inability to figure it out. Your responses have been timely and invaluable. That being said I need to bug you some more about this.
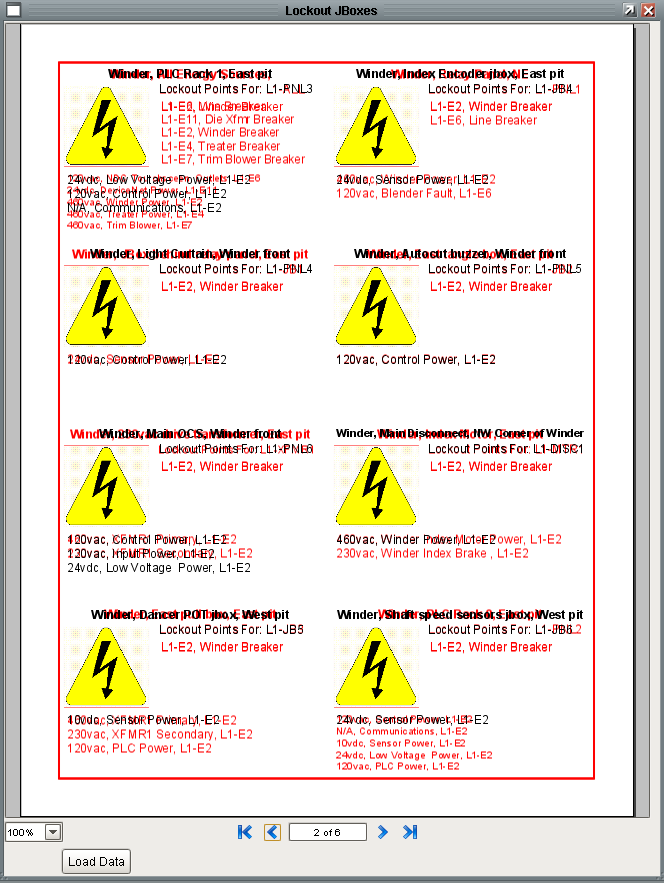
I attached a screenshot and window and as you can see I am very close to finishing. I started with your scripting and concatenated the lockoutpoints and prevented duplicates. I ended up with a dataset with all of the needed information in each row without need a detail record. With this I was able to use the label shape and make all labels the same size.
I do have a question about the formatting. I am trying to place a red border around each label. If I use the “stroke” then I get a single border around the whole page even though in the designer it shows a border around each label.
If I use the “shadow” with an offset of zero then strange things happen. It appears that once the text is written to the screen it doesn’t get refreshed.
Not sure about your shadow problem, but the border is easy to solve - you’ve got the stroke on the entire label container, not the individual label. Notice when the prototype label box has the light red highlight when you’re applying the stroke.