Id like to display my start-end date data within the hour specified but when I select historical data it defaults to showing many days previous not just the 23.59 hours like requested. i want to fill the whole page with the data from the hours i have selected.
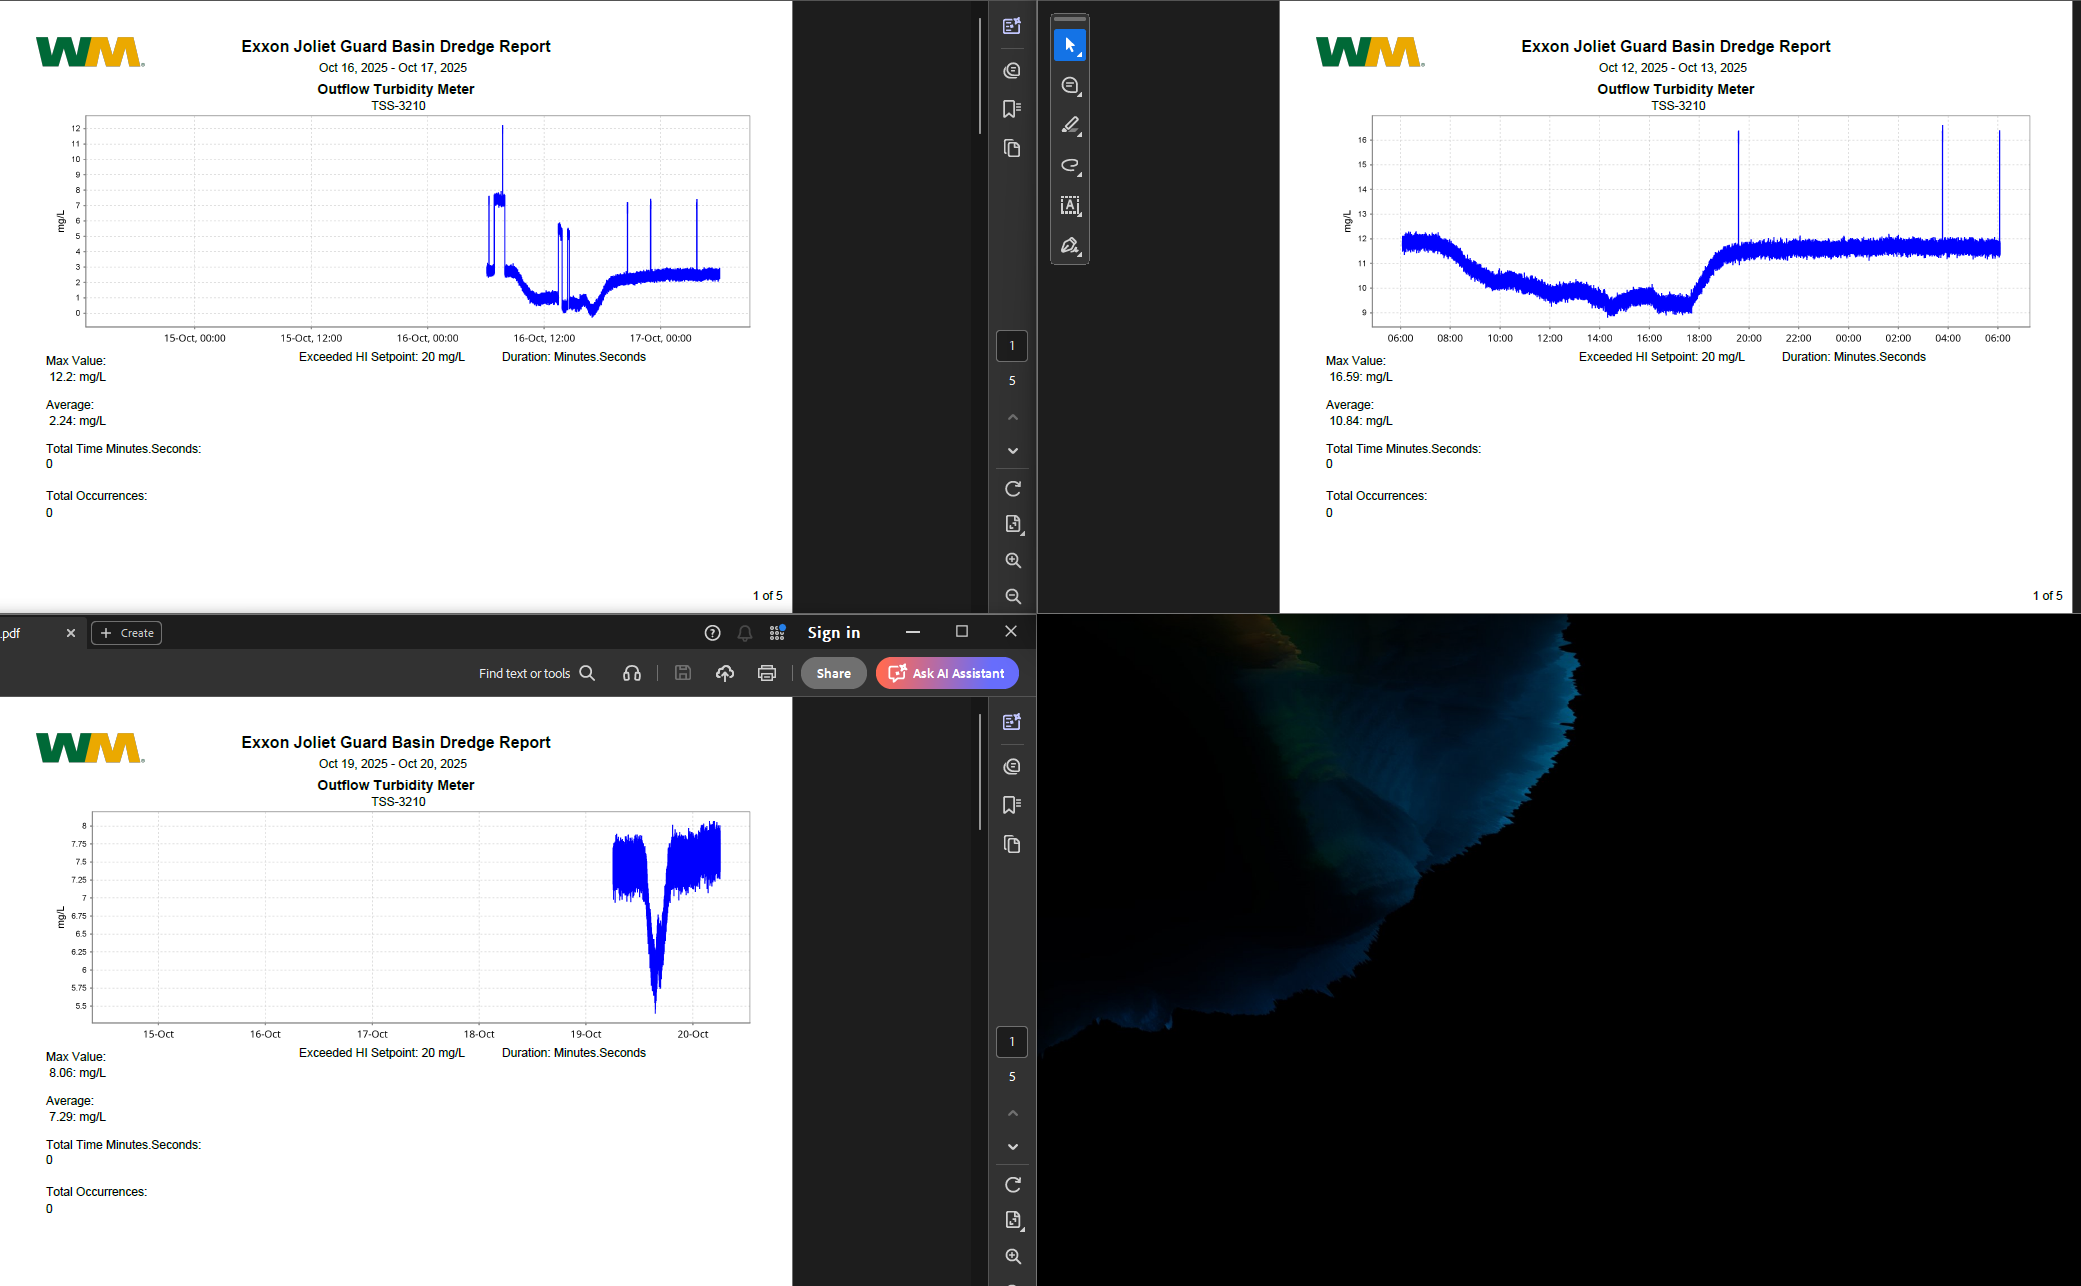
below i have 3 reports that were automatically generated but all 3 are different.
Show how your reports are configured. We don't have access to your system and don't know how your reports are configured or constructed, you've only provided photos of generated reports.
Reports are automatically generated each day using the start date parameter -24 hours.
we have the ability to generate a custom report on this screen where you can input any date range. On this page i get the same result as my above screen shots for those selected date ranges.
Let me know specifically what else I should share.
Do you have Ignition designer access to the project that houses this screen/report? We need to see the designer side configuration to be able to help determine what is causing the mismatch between selected date range and generated report.
I would guess that there is some value that is not being passed for some reason and the report is using a default time span, hence the display of a few days worth of data.