We went from 8.0.11 to maybe 13, then on 8.0.15 RC1 (due to an emergency fix) yet not on the stable, but sometime after 8.0.11, we have a fully scripted report that generates 3 pdfs and 3 cvs documents that get emailed. We run the report manually, so nothing scheduled. The report uses system.tag.queryTagHistory with the Average and Maximum aggregates to generate most of its data, with 100 pages total with about 30 rows each page. This used to take around 6 minutes, but now is taking more than 4 hours. Does anyone know what may have changed? Thanks
I don’t know of anything specifically, so we’ll have to do some digging.
First, turn the reporting logger for that report’s path to trace. (See the MDC key section of https://docs.inductiveautomation.com/display/DOC80/Troubleshooting+Guides for how to do this). This will give you things like start and stop times for the data queries and the report generation, so you can tell if it’s the query taking a long time or the report.
In either case, I’d strongly suspect something is starved for memory and having to go to disk a lot to get this kind of time increase. (either the gateway or your database).
I troubleshooted this last night by manually running the report again with turning on the MDC key method. As I watched, the logs on the gateway status page were flipping through hundreds of thousands of entries, rewriting itself over and over (with times of turning live values off to pause the screen). I tried to watch for patterns, but saw a lot of queries of what it seemed it needed. It got late when the report finished, so I was only able to look at the logs in the morning, but only show the last timeframe of entries and can’t see what might be going on there.
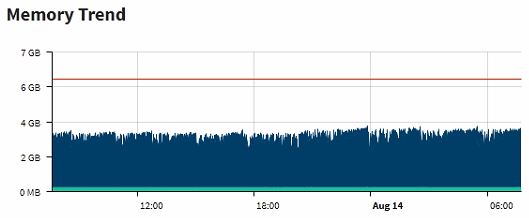
As far as memory, here’s the gateway cpu and memory snippets below. Notice the cpu spike showing the timeframe when the report was running and match to the memory chart, both seems normal there. So maybe the database server?

I have been working with IA support a lot on this and have not found the issue yet. We are suspecting the threading performance it uses through reports. We also tried this script (only taking out the report specific generating key) in a tag event script and it takes a long time too. However, when done in the script console, it only takes 6-7 minutes as it did originally in the Report module.
Has anyone else experienced this kind of issue?
Try running it on an asynchronous thread so it is outside the throttled environment of an execution manager. If that fixes it, I would work around the problem by dispatching the asynch thread using my later.py script, and recovering its return value from the supplied CompletableFuture. (From in the report’s data script.)
Consider using java.lang.System.nanoTime() at numerous points in your script to identify any particular queries that have regressed (for IA to investigate).
This is my first time trying to use your later.py script. So I basically copy and past this into our project library (as a new shared global script). How do I call or which definition within later.py do I call? I’m assuming I would do this within the Report’s data script like you mentioned?
Thanks
Yes, I recommend it be placed at or near the root of your inheritance hierarchy. If you’ve upgrade from v7.9, calling it shared.later would make sense. On new installs I would just call it later.
So your data script would have something like this:
	# Pass individual parameters as needed for the queries
	f = later.callAsync(someModule.mySlowQueryFunction, parameters...)
	# If mySlowQueryFunction returns a single data key
	data['newKey'] = f.get()
You could also pass the data dictionary to the slow function and let it populate multiple keys. If you do that, you still need f.get() to hold the report until the async thread completes.
I was able to get this to utilize the later.py script on the first try, but unfortunately it didn’t help the time.
What about my advice to sprinkle calls to System.nanoTime() through your script to see if the problem is concentrated in one or a few spots? Compare what you get from that to running in the script console.
I haven’t yet, I can give that a try. Would this be similar to making a bunch of system.util.getLogger everywhere? We did this which created a timestamp to the gateway. May not be as precise as the nano, but this at least gave us a general idea of when things were happening, especially when something went from 6 minutes to 4 hours.
It would be similar, yes. nanoTime() is recommend for this sort of thing, though, as it is guaranteed to be monotonic. It also gives you the option to collect and do delta math within the function for multiple points and then use a single log call to report them.
We finally were able to fix this, it goes back to what we suspected it was which I will describe below. On a side note, pturmel’s later.py came in handy. Another issue going back before this which was a known bug, was the length of time to generate xlsx files. It took many hours and was due to how the report handled formatting each cell exponentially increasing the time. While this was fixed in recent versions, if we ran the report as we had it originally, our xlsx would be blank, but pdf’s would be fine. By using the later.py callAsynch, it generates everything in full. (Is this a thread/memory/race condition issue?)
Anyways, a few months back, after our tag structure wouldn’t save any changes or new tags, we created a new tag provider, exported most tags over renamed them so the new was the same name as the default. What this did was create a lot of duplicate tagid entries in the sqlth_te table without retiring the old, along with the associated entries in the scinfo and drv tables. We even created tickets on this with support before doing this with no resolution as well as noting this in our recent ticket on our report length issue. So what I did was a few queries to delete all of these extra entries out. I also looked and saw that only a 10-20 minute windows of time used these new tagids during the renaming process above, so we didn’t care to update the tagids in the data partition table affected (can always later).