Design question - We would like to track parts through a particular portion of a process. All we want is to graphically illustrate (like on a chart) where the parts are in this one portion of the process (since the parts are obscured from view as they travel through this portion).
What we have tried so far is setting up a transaction group with three columns - t_stamp, part_bit (triggered and enters a 1 when a part enters the machine), and part_track_ndx. Everything is tracking and logging correctly, but the problem comes in when we go to graphically represent the position of the parts. Only 1500 parts fit in the machine, so we only want to display the last 1500 triggers (note - a trigger will log either a 1 for a part, or a 0 for a gap). On the charts we seem to only be able to represent parts via the t-stamp or ndx column.
Question (finally) - Is there a way to limit the number or DB records to 1500, and to have it work in a FIFO fashion? i.e. update the first record, have all others index back one, then drop the 1501st record? Any help or alternative ideas are greatly appreciated.
Thanks!
Wow! A lot to digest here…
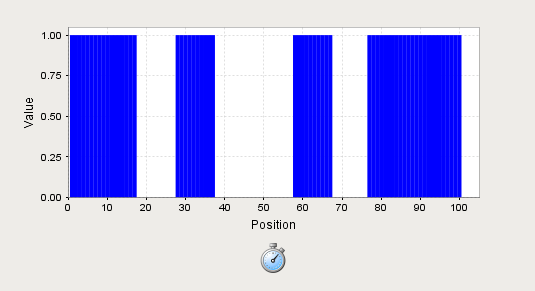
My example does it for 100 samples, but you can easily change it to the 1500 you require… 
The other caveat is that this uses MySQL. Syntax will differ slightly for other platforms.
The top priority would be to display the data as you want it. The XY Chart will work best for us because we can make the X-axis however we want. But first we want to get the data by rank. I stuck a timer into the container and used this script in the propertyChange Event:
query="SELECT Ramp FROM FIFO1 order by t_stamp desc limit 100"
table1 = system.db.runQuery(query,"MySQL")

headers = ["Rank","Value"]
i=0
rows=[]
for row in table1:
	i += 1
	newrow=[i,row[0]]
	rows.append(newrow)

event.source.parent.getComponent('Chart').Data=system.dataset.toDataSet(headers, rows)
This gets the data into the XY-chart as rank (1-100) and value (0/1).
Opening the Chart Customizer, we now need a new Number Axis type for the X-Axis:

In the Dataset Properties tab:

Presto! You now have a ranked status chart. This is how I used to do Status Charts before Status Charts existed. 
The second part on limiting the table size the the last 100 (still using my example here) rows can go something like this:

In the transaction group that adds rows to the FIFO two Expression Items are added. The first gets the oldest timestamp of the newest 100 rows:
Select min(t_stamp)
FROM (Select t_stamp
		From FIFO1
		Order by t_stamp desc
		limit 100) as t_stamp
The second deletes everything older than the DateTime you just got, leaving 100 rows left in the table:
DELETE FROM FIFO1
WHERE t_stamp<'{[.]Oldest 100th Date}'
Borrowing Carl’s tagline: Hope this helps!
Regards,
Wow Jordan!! That is fantastic!!
This is exactly what we are looking to do. The FIFO portion was the main crux of our holdup, and you nailed it perfectly. We’ll be implementing this first thing this morning. Thanks a million for your help and sample.
Regards, 
Wow, great post Jordan.
Jordan, I think qualifies for posting in here.
![]()
Hello,
We have been runnign the code that Jordan suggested for about a year, in a Property Change Event Handler (see below):
query=“SELECT L1_SECA_ITEM FROM L1_DRYER_TRACK ORDER BY t_stamp desc LIMIT 80”
table1 = system.db.runQuery(query,“PM_DATA”)
headers = [“Rank”, “Sticks”]
i=0
rows=[]
for row in table1:
i += 1
newrow=[i,row[0]]
rows.append(newrow)
event.source.parent.getComponent(‘L1_SECA_FILL’).Data=system.dataset.toDataSet(headers, rows)
This query works great - it brings back two columns, one as Rank, and one as Sticks, with Rank column automatically filled in, and Sticks as a column. However, now we want to add a column called Shape Change. This column already exists in the DB, but when we add it to our query, and to our headers in the code above, we get an error saying that the number of columns in the table and our headers do not match. We have tried many different configurations of this with no success. Does anybody know how we can add a column to our query and to our headers?
Thanks.
Sure just do the following:[code]query=“SELECT L1_SECA_ITEM, SHAPE_CHANGE FROM L1_DRYER_TRACK ORDER BY t_stamp desc LIMIT 80”
table1 = system.db.runQuery(query,“PM_DATA”)
headers = [“Rank”, “Sticks”, “ShapeChange”]
i=0
rows=[]
for row in table1:
i += 1
newrow=[i,row[0],row[1]]
rows.append(newrow)
event.source.parent.getComponent(‘L1_SECA_FILL’).Data=system.dataset.toDataSet(headers, rows)[/code]
Travis,
That did it. Thank you for posting the necessary correction, and I see where I was going wrong:
newrow=[i,row[0],row[1]]
Thank you.