May I ask if there is a solution for Sankey diagrams in the current version 8.3?
i4Cortex vCortex has a sankey diagram in its visuals pack. @nader.chinichian probably has some good screenshots of it in action.
Yes we have eCharts pack in our modele. You just need to download and install it and check our demo project in your gateway. I include 4 different type of Sankey for reference.
I just opened it and took a look—the quoted price is too expensive for me.
If you have webdev module licensed in your gateway you can bring sankey chart js code via iframe in your project and pass chart data in URL parameters.
Embr Chart’s Chart.js component includes this Sankey diagram plugin:
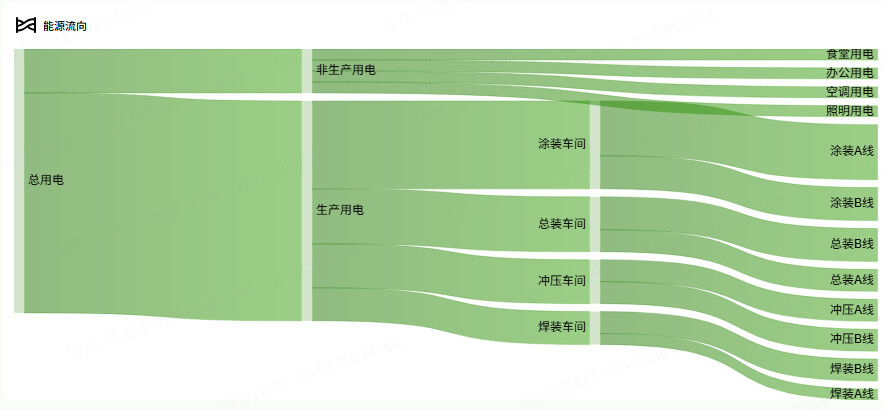
Thank you very much. I didn't realize that Sankey diagrams were supported until I clicked on the Chart.js section for types. I successfully created an energy flow chart and would like to ask an additional question: do you know which parameter can sort the data in the order of 'data'? In ECharts.js, I found a property parameter 'layoutIterations=0', but it didn't work. I added labels, and somehow by chance, it succeeded (in Figure 2, it changed to the order of my 'data'). Do you know why this happened or if there is a better approach?
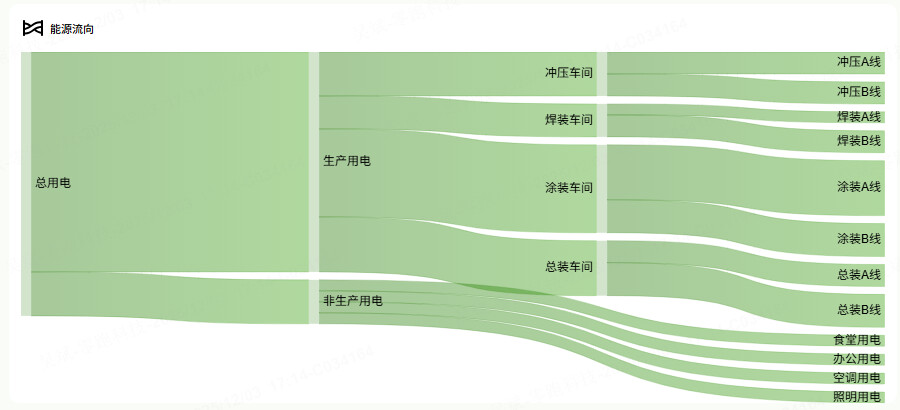
Chart.json
[
  {
    "type": "embr.chart.chart-js",
    "version": 0,
    "props": {
      "type": "sankey",
      "data": {
        "datasets": [
          {
            "alpha": 0.4,
            "animation": {
              "delay": 0,
              "duration": 1000,
              "easing": "easeOutQuart",
              "loop": false
            },
            "animations": {
              "colors": {
                "properties": [
                  "color",
                  "borderColor",
                  "backgroundColor"
                ],
                "type": "color"
              },
              "numbers": {
                "properties": [
                  "x",
                  "y",
                  "borderWidth",
                  "radius",
                  "tension"
                ],
                "type": "number"
              }
            },
            "borderDash": [],
            "borderWidth": 0,
            "colorFrom": "#23780433",
            "colorTo": "#389E0D33",
            "cubicInterpolationMode": "default",
            "data": [
              {
                "flow": 200000,
                "from": "总用电",
                "to": "生产用电"
              },
              {
                "flow": 40000,
                "from": "生产用电",
                "to": "冲压车间"
              },
              {
                "flow": 30000,
                "from": "生产用电",
                "to": "焊装车间"
              },
              {
                "flow": 80000,
                "from": "生产用电",
                "to": "涂装车间"
              },
              {
                "flow": 50000,
                "from": "生产用电",
                "to": "总装车间"
              },
              {
                "flow": 20000,
                "from": "冲压车间",
                "to": "冲压A线"
              },
              {
                "flow": 20000,
                "from": "冲压车间",
                "to": "冲压B线"
              },
              {
                "flow": 10000,
                "from": "焊装车间",
                "to": "焊装A线"
              },
              {
                "flow": 20000,
                "from": "焊装车间",
                "to": "焊装B线"
              },
              {
                "flow": 50000,
                "from": "涂装车间",
                "to": "涂装A线"
              },
              {
                "flow": 30000,
                "from": "涂装车间",
                "to": "涂装B线"
              },
              {
                "flow": 20000,
                "from": "总装车间",
                "to": "总装A线"
              },
              {
                "flow": 30000,
                "from": "总装车间",
                "to": "总装B线"
              },
              {
                "flow": 40000,
                "from": "总用电",
                "to": "非生产用电"
              },
              {
                "flow": 10000,
                "from": "非生产用电",
                "to": "食堂用电"
              },
              {
                "flow": 10000,
                "from": "非生产用电",
                "to": "办公用电"
              },
              {
                "flow": 10000,
                "from": "非生产用电",
                "to": "空调用电"
              },
              {
                "flow": 10000,
                "from": "非生产用电",
                "to": "照明用电"
              }
            ],
            "fill": false,
            "hidden": false,
            "hoverColorFrom": "#237804",
            "hoverColorTo": "#237804",
            "label": "用电流向",
            "labels": {
              "a": "非生产用电",
              "b": "生产用电"
            },
            "parsing": {
              "flow": "flow",
              "from": "from",
              "to": "to"
            },
            "pointStyle": "circle",
            "priority": {},
            "type": "sankey"
          }
        ]
      },
      "options": {
        "plugins": {
          "legend": {
            "display": false
          },
          "tooltip": {
            "displayColors": false,
            "intersect": false,
            "mode": "point"
          },
          "zoom": {
            "pan": {
              "modifierKey": null
            }
          }
        },
        "scales": {
          "x": {
            "type": "linear"
          },
          "y": {
            "type": "linear"
          }
        }
      }
    },
    "meta": {
      "name": "Chartjs"
    },
    "position": {
      "grow": 1
    },
    "custom": {}
  }
]
I don’t have time to test anything, but according to the documentation you can set a priority property to control the order of the nodes.
Copied from GitHub:
const colors = {
  a: 'red',
  b: 'green',
  c: 'blue',
  d: 'gray'
};

const getHover = (key) => colors[key];
const getColor = (key) => colors[key];

const chart = new Chart(ctx, {
  type: 'sankey',
  data: {
    datasets: [{
      label: 'My sankey',
      data: [
        {from: 'a', to: 'b', flow: 10},
        {from: 'a', to: 'c', flow: 5},
        {from: 'b', to: 'c', flow: 10},
        {from: 'd', to: 'c', flow: 7}
      ],
      colorFrom: (c) => getColor(c.dataset.data[c.dataIndex].from),
      colorTo: (c) => getColor(c.dataset.data[c.dataIndex].to),
      hoverColorFrom: (c) => getHover(c.dataset.data[c.dataIndex].from),
      hoverColorTo: (c) => getHover(c.dataset.data[c.dataIndex].to),
      colorMode: 'gradient', // or 'from' or 'to'
      /* optionally override default alpha (0.5) applied to colorFrom and colorTo */
      alpha: 1,
      /* optional labels */
      labels: {
        a: 'Label A',
        b: 'Label B',
        c: 'Label C',
        d: 'Label D'
      },
      /* optional priority */
      priority: {
        b: 1,
        d: 0
      },
      /* optional column overrides */
      column: {
        d: 1
      },
      size: 'max', // or 'min' if flow overlap is preferred
    }]
  },
});
could you please provide the link here? for eChart pack module