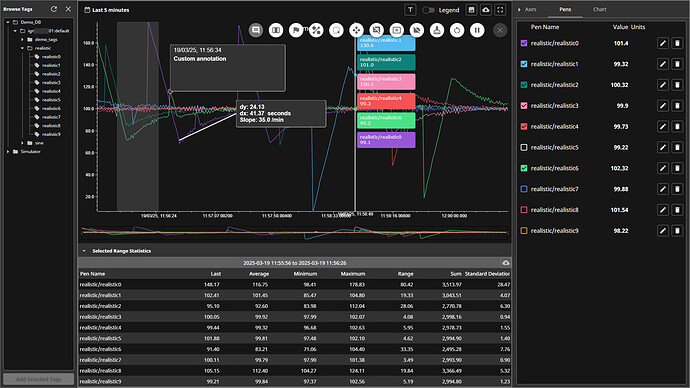
SC Charts
Streamline Control is excited to release SC Charts, an advanced trending module for Ignition's Perspective platform.
These charts are designed to handle large datasets efficiently, offering smooth rendering and real-time updates for timely decision-making. The visuals are dynamic and customizable, making data interpretation easier and more engaging. Experience enhanced performance, with advanced features that support complex overlays, customizable gradients, and powerful drawing tools.
Design Philosophy
Properties were constructed alongside our internal integrators to allow users to create trends with a familiar interface while having the potential to scale features to meet client needs. The goal of the chart is to be able to meet as many requirements as possible without the need to develop multiple components.
There are many features in our roadmap which have not made this first release but we are excited to continue to improve this module to meet and exceed our clients expectations as well as yours.
Performance
The video below demonstrates the rendering of two pens with randomized data of over 100,000 rows as well as the incremental generation from 0 to 100,000 rows for two pens with complete resolution.
Drawing Tools + Overlay
Use Ignition events and two-way properties to implement custom functionality for annotations, measurement lines, and range brushes to ensure your charts meet all your project requirements.
SC Charts allows the developer to specify multiple data sources on the same graph with a variable number of both x- and y-axes. This can be leveraged to compare real-time and historical data on the same graph.
Get Started
Documentation and downloads can be found here and will be updated as necessary.
See our getting started guide.
See our properties documentation.
Make sure to checkout our development roadmap to keep up to date with current development and future features.
Check out our website for further information about the module, licensing, and to get in touch.
Third-party module showcase: SC Charts
Exchange resources pending approval!
Stay tuned for future module releases from Streamline Control.


