Ignition 7.9.4
I’m putting together a template that only shows the chart without any labels. Depending on what machine is passed in, the chart should display the status from the last 24 hours, kind of like a progress bar. But it reads from right-to-left. In our application, it would be more intuitive filling in left-to-right.
I can’t change it like I can a property on the progress bar.
I can’t rotate it.
We started out by binding it to tag history and can’t figure out how to manipulate that data.
I’m attempting to bind the dataset to a SQL Query to maybe sort differently, but haven’t been able to make that work.
Has anyone been able to reverse the display for the series chart?
Thanks!
If you just want to pull tag history data, but display it with largest timestamps on the left, the Easy Chart has an 'Invert Time Axis' property directly:

With the Classic Chart, you can fire a configureChart script:
chart.getPlot().getDomainAxis().setInverted(True)

Thanks for your response! I was hoping it was as simple as selecting a property, but I haven’t seen one.
The scripting sounds like it might be an option. Hopefully there’s something hidden that I can configure. I’ll try down that path.
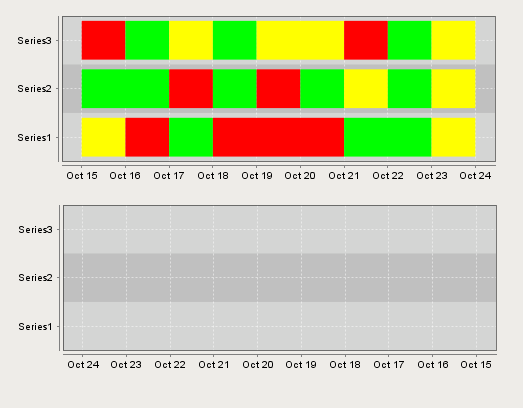
This is what we’re displaying, and essentially I want it rotated 180°:

Apologies - I completely glossed over that you were using the Status Chart. That said, basically the same code functions - but it doesn’t appear to actually do what you want (in some quick testing):
You can add this to the propertyChange event handler:
if event.propertyName == 'componentRunning':
	event.source.getChart().getPlot().getDomainAxis().setInverted(True)
And it will flip the order of the series displayed (eg, series 3, 2, 1 instead of series 1, 2, 3). You can also change it to getRangeAxis().setInverted(True), and it will flip the displayed dates - but it appears the rendering we’re doing over the top of things doesn’t know how to handle that, and so it just disappears completely: