Hi,
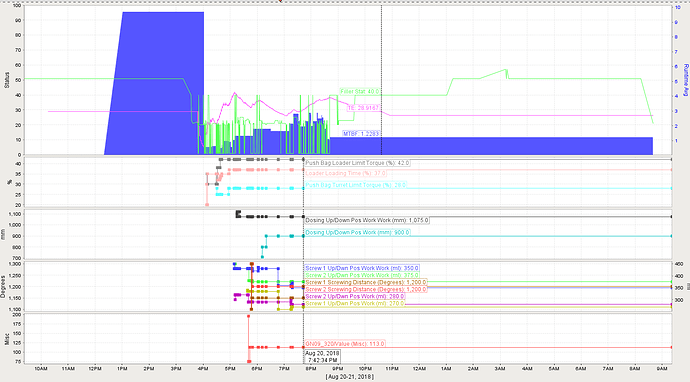
I am trying to make a trend to show setpoint changes on a subplot and KPIs on the main plot. The goal being that you can see when setpoints were changed and how it effected the line’s productivity. The issue I’m running into is only showing ClosestValue data and nothing else. With a possible 81 different setpoints, its important to show the data as cleanly as possible. I only add a tag to the trend if it has changed within the allotted time period and the tags are set to Unlimited in the historian so they will not store data periodically. However, with the pens set to ‘Line and Shape’ I still show shapes for every pen whenever one of them changes. I figured this is by design, but was hoping someone could help me show the data so the shapes only show up when that particular setpoint has changed.
Thanks,
John
