Hello All,
I have few named queries which run very fast sometimes and sometimes takes upto 2.5 mins to run the query. I read about the Slow queries and tried to troubleshoot it. Used the same query in the MS SQL server application and it runs exactly how I want it to be. Logger also shows ‘Slow Query’
So its kind of weird how it runs very fast sometimes and runs very slow sometimes. If anyone can shed some light on this topic, it would be appreciated.
We can’t even hope to help you without seeing the query.
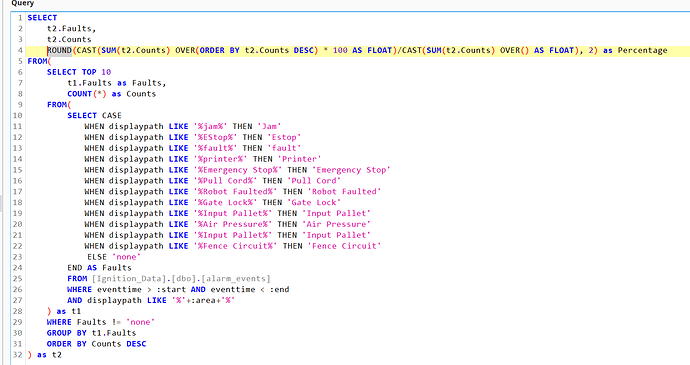
Sorry my bad I thought I had attached the image.
SQL
SELECT
    t2.Faults,
    t2.Counts
    --ROUND(CAST(SUM(t2.Counts) OVER(ORDER BY t2.Counts DESC) * 100 AS FLOAT)/CAST(SUM(t2.Counts) OVER() AS FLOAT), 2) as Percentage
FROM(
    SELECT TOP 10
        t1.Faults as Faults,
        COUNT(*) as Counts
    FROM(
        SELECT CASE
			WHEN displaypath LIKE '%jam%' THEN 'Jam'
			WHEN displaypath LIKE '%EStop%' THEN 'Estop'
			WHEN displaypath LIKE '%fault%' THEN 'fault'
			WHEN displaypath LIKE '%printer%' THEN 'Printer'
			WHEN displaypath LIKE '%Emergency Stop%' THEN 'Emergency Stop'
			WHEN displaypath LIKE '%Pull Cord%' THEN 'Pull Cord'
			WHEN displaypath LIKE '%Robot Faulted%' THEN 'Robot Faulted'
			WHEN displaypath LIKE '%Gate Lock%' THEN 'Gate Lock'
			WHEN displaypath LIKE '%Input Pallet%' THEN 'Input Pallet'
			WHEN displaypath LIKE '%Air Pressure%' THEN 'Air Pressure'
			WHEN displaypath LIKE '%Input Pallet%' THEN 'Input Pallet'
			WHEN displaypath LIKE '%Fence Circuit%' THEN 'Fence Circuit'
            ELSE 'none'
        END AS Faults
        FROM [Ignition_Data].[dbo].[alarm_events]
        WHERE eventtime > :start AND eventtime < :end
        AND displaypath LIKE '%'+:area+'%'
    ) as t1
    WHERE Faults != 'none'
    GROUP BY t1.Faults
    ORDER BY Counts DESC
) as t2
Or even better, use triple backquotes (`) and add the language like so:
```SQL
code
```
It will add syntax highlighting, which is always nice. Example:
select t2.Faults, t2.Counts, round(cast(...)) from your_table where Faults != 'none'
In addition, can you throw this query into the Workbench of your specific DB flavor, and run an EXPLAIN query on it? We don’t know what indexes or table relationships you already have or not. The EXPLAIN statement of a query will indicate where it slows down, if it has to do full table scans, etc.
Though I do see you are querying directly from the alarm_events table and you’re using displayPath LIKE '%area%' in the WHERE clause and these are usually performance killers. Not to mention all the other LIKE '%stuff%' in your CASE select statement though I’d think this is less problematic than the where clause one.
Do you have an index on just eventtime? If not, add one.
I do have an index for the eventtime. Here is the snapshot from the application.
and this what logs show
So you are saying it will always run quick in a query in management studio? You aren’t limiting the results in studio? Doesn’t make much sense that it would run differently, unless you aren’t running the same query in both.
Please show the EXPLAIN statement for the query.
Exact same query was run on the management studio and on ignition. The problem though was sometimes it would run fast and sometimes it would be very slow. FYI the named query was then bounded to the table’s data source.
So I wrote the same query, but this time using the script transform (system.db.runQuery) and now it works really well. But still beats me why was it slow using the Query Binding.
I've had the same issue with a Named Query, a simple query that runs fast in management studio, but really slow as a Named Query. I'm also not sure what could trigger this, but I was calling not all available parameters in my named query.
for example:
I called:
params = {
"from_date": date1,
"to_date": date2,
"param1": value1
}
While my Named query also accepted param2. I don't know why it behaved in this way, but by passing all params is how I worked around it.
If you don't pass a param then the param value defaults to NULL which depending on your query structure could make it far less efficient or take much longer.


