Hello,
Setting up an Easy Chart in Historical mode, to work with Historical Tags. I need to show the same data as the hardwired chart recorder. My Easy chart does not show the data the same as the hardwired chart recorder. I think I’ve got a tag property or chart property wrong, as it shows data oddly. Sometimes it’s a straight line, as if it is interpolating between two points (across a span of days?!) sometimes it looks like it is recording properly.
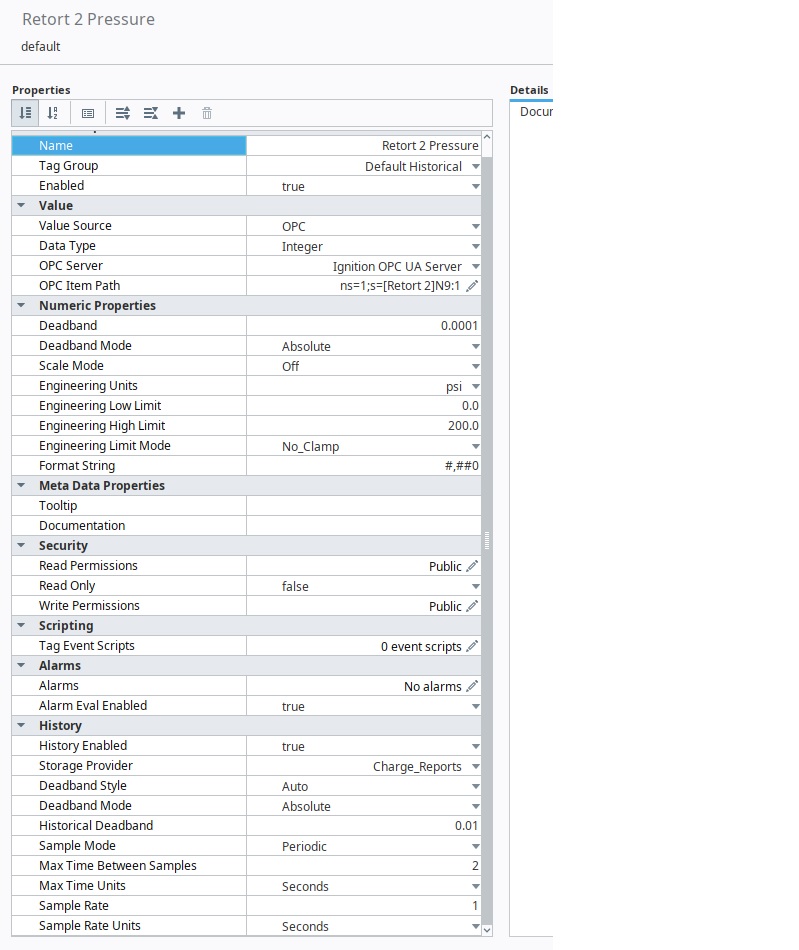
I’ve added pictures to show the chart and tag configurations, as well as the reference chart recorder. All data is using the same input at the PLC, so I should be able to reproduce the chart recorder in the easy chart, but with greater historical ability. Can someone spot something I’ve got wrong?
Does the data stop trending due to the gateway trial timeout, and then it is interpolating the data between trial resets?
.