I have a fairly slowly-changing signal that for some reason, the most recent value has a dataquality value of 600 (legacy Unknown, I think). The quality has since recovered and the value is fine, but the historian has not yet written an updated value.
On the corresponding Easy Chart, the line ends with that last value. If I select Ignore Bad Quality Data, the line is extrapolated out to the current time on the chart. But once the last good point ages out of the chart, it becomes completely blank.
- If the historian writes a value when the tag quality changes to Unknown, shouldn't it also write a value once the quality goes back to Good?
- It doesn't seem like my charts should go blank if Ignore Bad Quality Data is selected and the last data point isn't Good quality.
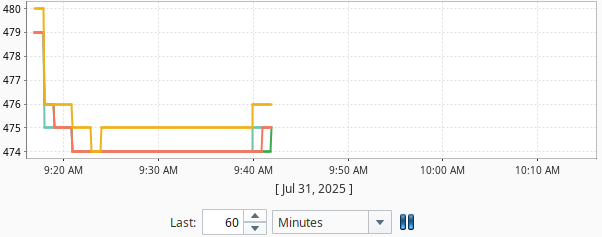
Here's what the chart looks like with Ignore Bad Quality Data set to false:
And here is that same chart, after changing the duration to the most recent 15 minutes, even with Ignore Bad Quality Data set to true: