I’m struggling to get EasyCharts to display accurate analog history data.
The data compression algorithm is not (IMHO) working as it should. The description of the algorithm is a bit vague when it refers to “previous value” I’m not sure if it’s referring to the previously logged value, or the previously scanned value. In either case, the algorithm doesn’t work as it should.
I’ve historized two idential tags. One has a 10 minute Max Time Between Samples, and the other has a 5 second Max Time Between Samples
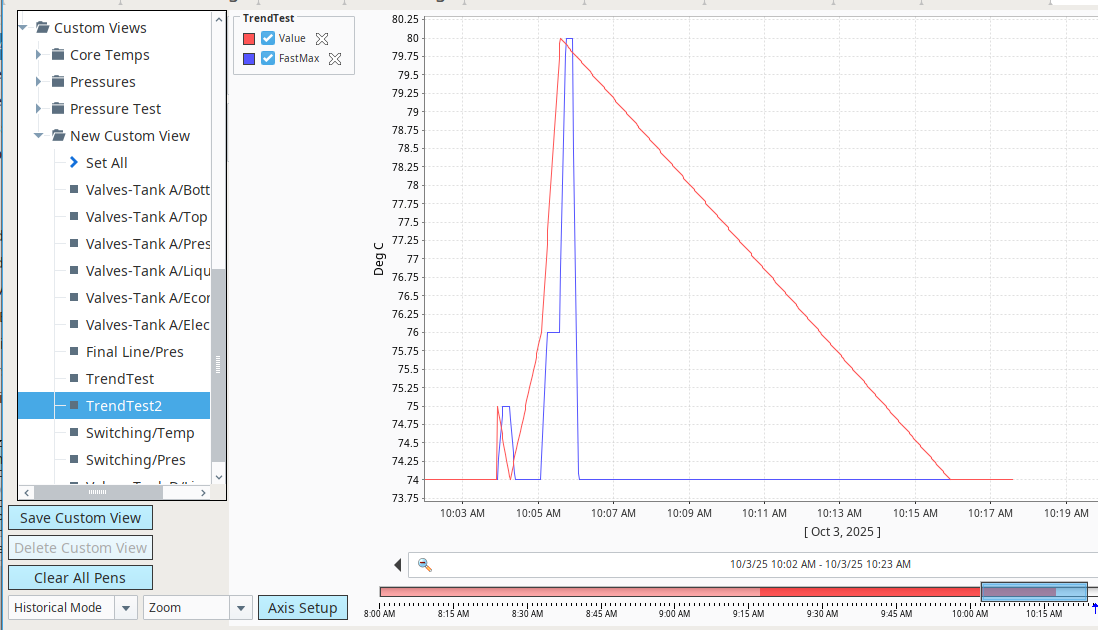
In the slower trend, the final change to value 74 is shown as a linear interpolation over the Max Time Between Intervals time span. I don’t think this is what anyone wants from their trend data. The history compression algorithm should have immediately logged a value to the database when the value dropped to 74.
The solution “could” be:
- Log the initial point to the database when history is enabled
- Monitor the tag and log a second point when the scanned value deviates by more than the deadband.
- Use the last two logged points to create a parallelogram around those two points with the upper and lower sides based on the +/- deadband. Extrapolate those two lines into the future.
- If the scanned value crosses either the upper or lower side extrapolation, log the 2nd to the last scanned value (before it crossed the limit).
- Re-calculate the parallelogram based on the new logged value and the previous logged value.
- Repeat.
This method WILL cause more records to be written, but will actually provide accurate data which is much more important than the database size.