I am using a historical trend to display the level of a water basin.
I have the historical deadband set to 0.05 and the max time between records set to unlimited.
I have the scan class set to 1000ms.
The tag history does not write a value to the historical db if tag is changing in a linear trajectory even though it is changing by more than the deadband. I believe that it is doing this because it knows that it just needs the starting point and ending point of the linear trajectory to be able to fill in the line segment and is therefore trying to compress the data into two points. The problem is that when the user is viewing the trend, it appears that the value is flat lined until the trajectory changes. This is misleading to the operators.
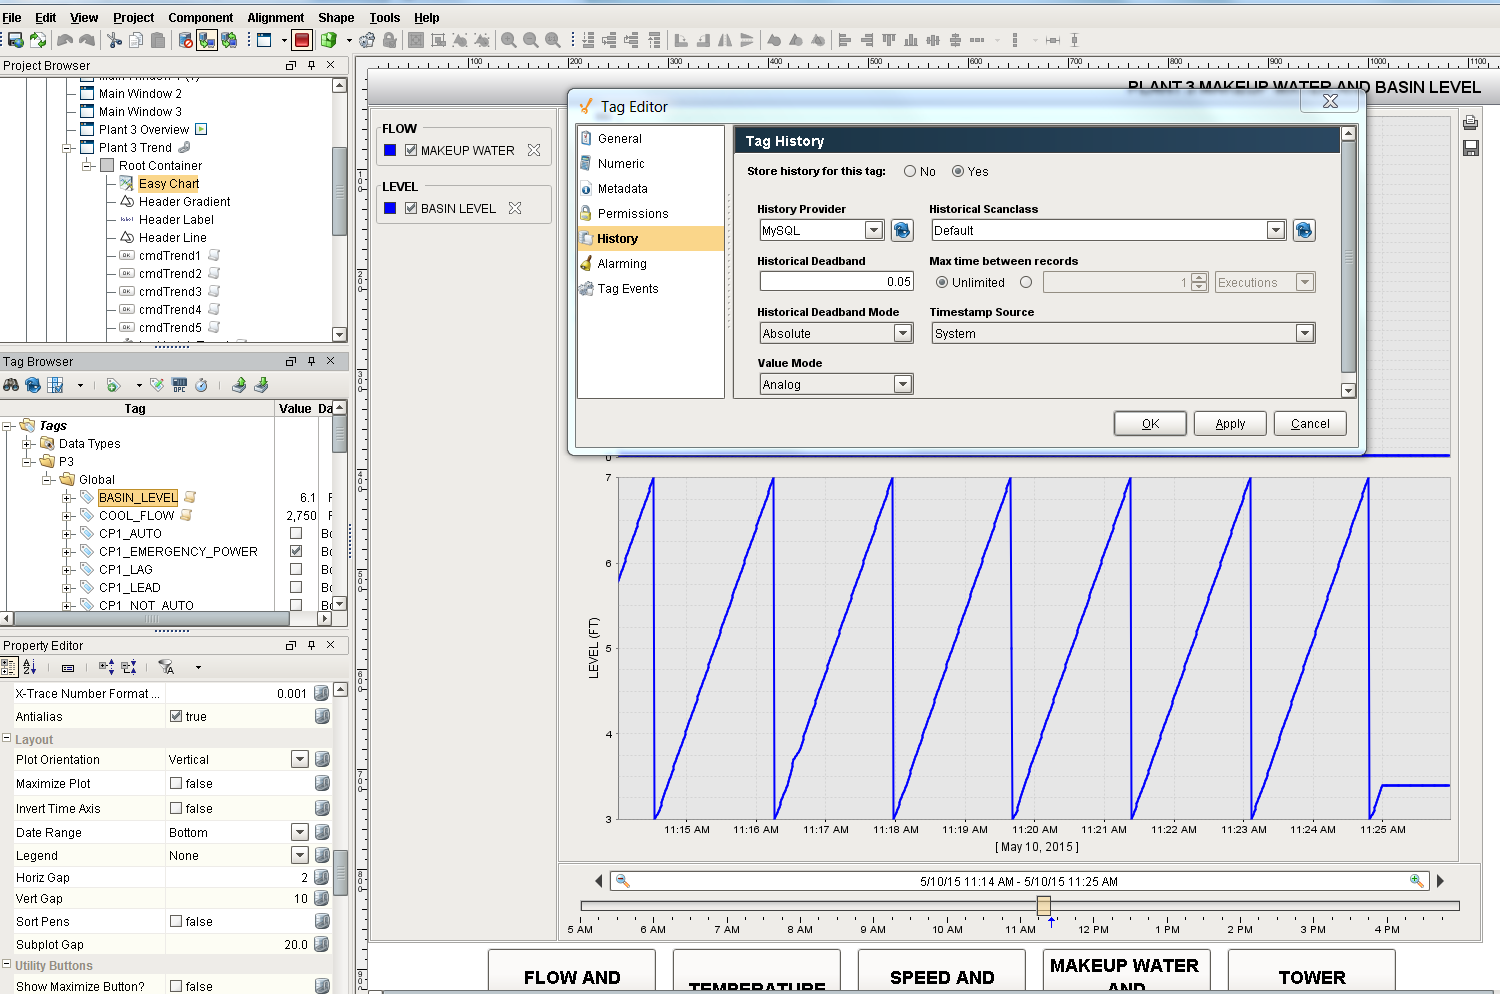
The screen shot attached shows an example of this. I have the PLC generating a saw tooth wave incrementing from 3 to 7 by 0.1 every 2500ms. With the tag history update and deadband settings, it should store each value 3, 3.1, 3.2 … to the historical database. Each saw tooth on the left looks OK because the line segment is complete. The current saw tooth on the right side of the trend, however, is flat lined. (It will appear as a full saw tooth once the trajectory changes).
Is there anyway to get around this behavior? I would prefer not store the history at a fixed rate because the level may stay constant for days until we fill or empty the basin. When we fill or empty the basin, however, the level will change on a linear trajectory.
You are correct it does turn off compression.
The Easy Chart, however, seems to be aware that it is set to digital and draws the trend as discrete steps rather than connecting the points with a sloped line.
We actually did take some steps to improve this situation in 7.7, but as I see now that there is one minor issue in dragging tags over that causes the new feature to not get used.
Long story short: if you include the realtime provider name in the historical path, it will attach the current value to the end of history queries like this. The full historical path has the format:
The various components can be left out or replaced with certain shortcuts in order to refer to “default connection”, “project default tag provider”, “local system”, etc. It gets kind of tricky, and frankly, now that I’m looking for it, the documentation is woefully… nonexistent.
Anyhow, straight to your situation. To have it build the full path for you, try adding the tag via the “find tag” browser on the easy chart pen configuration:
If you are using the default database with the default tag provider, you can shortcut everything with the format “[~]Path/To/Tag”.
Once you do either of these, assuming everything lines up, you shouldn’t see the flat line. There are still some tiny quirks, since it’s pulling in the latest value for the end, such as when the ramp goes back to the bottom, you might see the chart blip down until the actual historical value comes in, but generally this isn’t too bad.
We’re going to continue to improve this situation in 7.8.