Hi guys, have a good days.
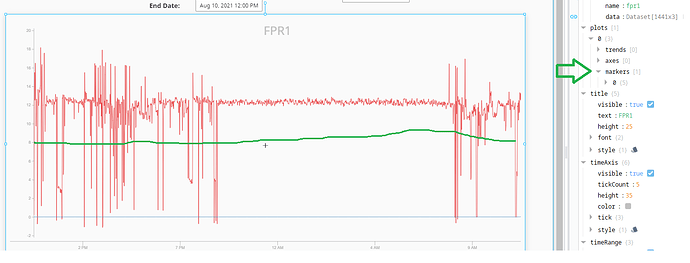
Currently, I’m using the tag history in the Time Series Chart to show my chart. In this case, I would like to show a marker or a maximum set point line to user. So, when the user see the chart they are able to know whether the chart got exceed the limit line or not.
Image below show the example that I would like to do.
May I know how can I do that. Thanks in advance.
