I’d like the timeseries chart to be screen size responsive.
Setting x-axis tickCount to auto does not work as expected. That is, number of ticks will be same number regardless chart width is big or small.
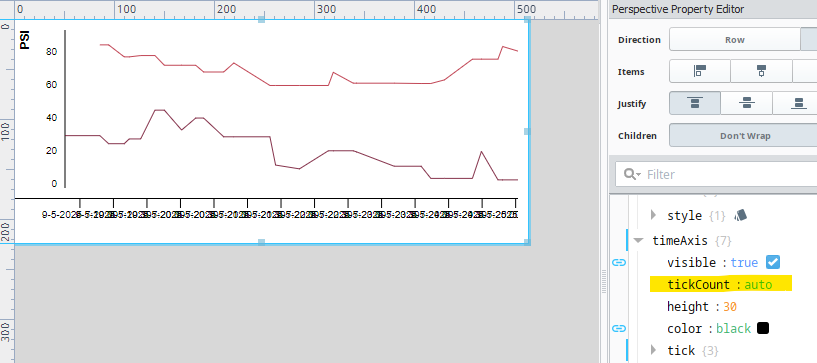
Any way to get around this?
Best if it is smart to auto adjust according to length of dates.
