Hi, I'm creating dynamic report using the nested query, In my parent query I collect the station information from Database then in child, I'm using the Tag Historian Query to pull my data for Timeseries chart. But I'm not sure how to pass the parent query information to child Tag Historian Query to make it dynamic.
can anybody suggest me some concept to make it work.
Reports aren't dynamic. They collect data when told to do so, and generate a static report from that data.
User interfaces like Perspective or Vision is where you create "live" displays.
@pturmel Thanks for reply.
Sorry, I will rephrase my question because I have updated my report, I created nested query with one child. In parent I'm getting the station number as Num, then I pass this parameter to the child query(Tag History Query). In the design on table header I add the station details & Timeseries chart but my chart not showing any values.


Hmmm. Can you see the data for the chart in your XML sidebar in preview?

Hmmm. That's odd. I'm not sure what is going on. Can you show the subquery as a top-level query with a manually-supplied station number? (I suspect {Num} isn't stringifying like you expect.)
Yeah I can do that. But my report table will adjust based on database details. Incase in future if I add stations in database then report don't know about it
Right, but just for testing. Show the tag path for one station for the chart data.

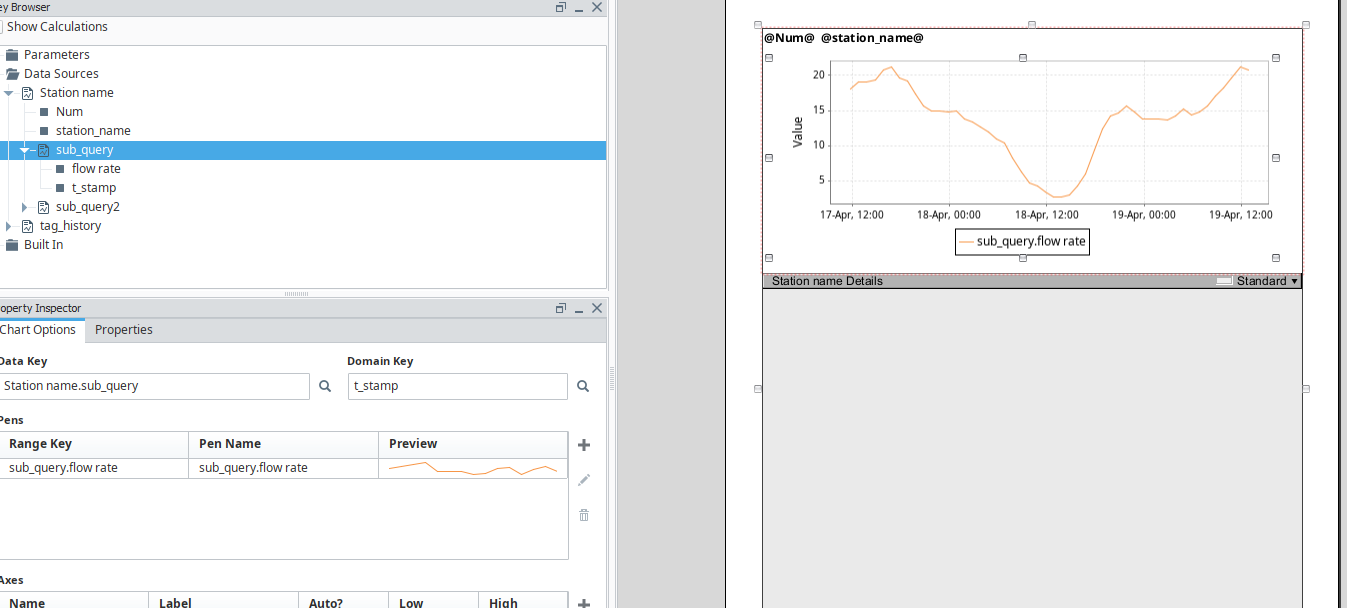
Hi, After I adjust the Data key, Domain key & Range key my chart working fine, Thanks for your support.
Can you explain how you got this to work ? Screenshots would help. Thanks.
Ran into this myself and found that I needed to modify my DataKey. To use the above screenshot as an example the data key was changed to station name[0].sub_query. Hope this helps anyone else running into similar issues