I have a TimeSeriesChart with one series defined with a single a dataset binding. The dataset is straight forward Column Time, Column ABC, Column TUV, Column XYZ. I would like my TimeSeriesChart to display the legend in the order of the dataset, however it appears to be random (or at least it appears that way). How do I set the sorting of the TimeSeriesChart?
A time series chart, as its name suggests, is only for time series data. You must have a timestamp column and provide the dataset sorted by that timestamp.
Hey. Apologies, updated the original post. The first column being a date/Time column.
Do you have a trends property in plots[0] with the desired order in its columns? (Not sure if that will do it, but that is what I would try first.)
I do have a trends property as suggested. However nothing that would suggest a sort option. Like I said in the original post the datsaset is sorted as desired. Attached a screenshot for reference.

You have no entries in plots[0].trends[0].columns. Consider populating that.
Thank you very much, that was exactly what I was missing!
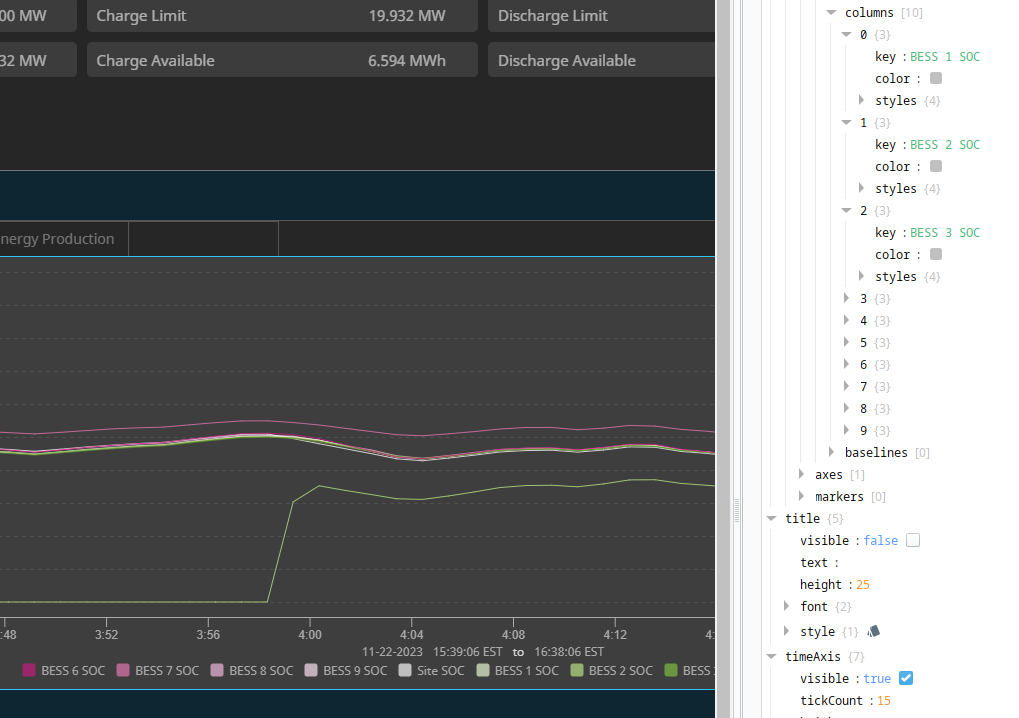
Your solution worked great for the first 8 coulmn entries. Thereafter, when I add another the sort order goes random again. I have confirmed my dataset column entries are correct, and matches the column key. Any thoughts on what could cause this behaviour?