In Perspective TimeSeriesChart, tag value not change , how to set ,let it show a straight line?
Tag SV - IN two minutes not change ,always equal 67.
But in chart ,it shows not a straight line.
How to set its property?
TimeSeriesChart display:
TimeSeriesChart Binding:
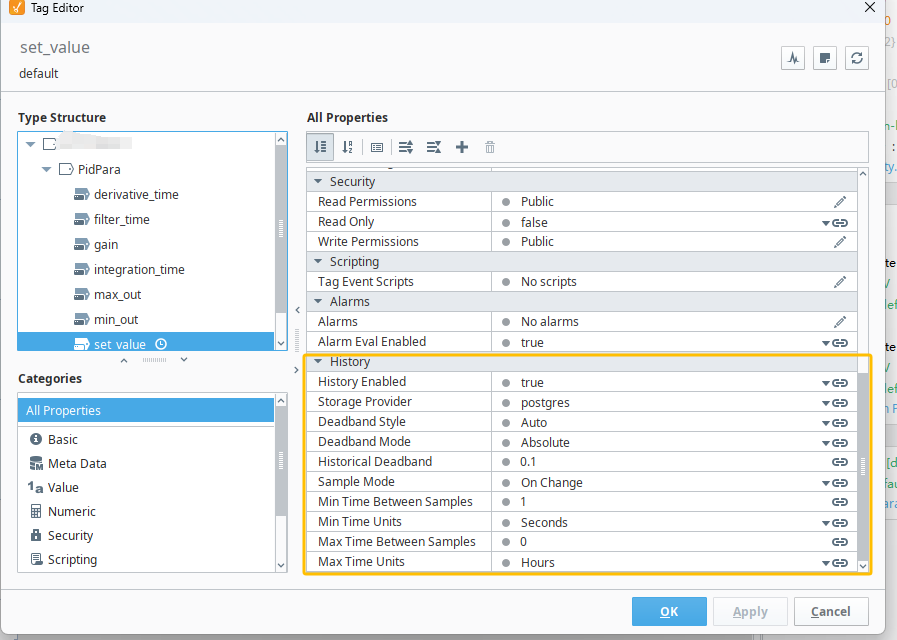
Tag history setting:
Try setting "Deadband Style" to "Discrete". This will only work with the new data that is saved after the change.
Yeah, Thank you !
Tag Hisotry Deadband Style set to Discrete: The value will not be interpolated.
The deadband will be applied directly to the value. That is, a new value (V1) will only be stored when: |V1-V0| >= Deadband.
Docs