Hey having some problems with getting a trend to be shown properly on a report.
I have a custom data set property on the report. This properly retrieves Tag History for display on a line graph in a report. I get the data from a certain starting point in time and a certain ending point in time. When I look at the data set results, the results int reflect what I expect.
When I try to show that data in a report, say in a line graph now just a table as I try to troubleshoot, the data is incorrect. The time stamps for the data are correct, but all my historical points are bringing back the same value.
Here is my data as shown in the designer which is what I would expect with the start/end times:

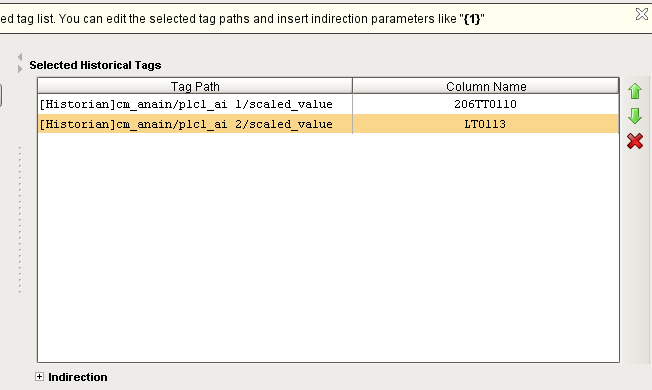
Here is my configured report table table:

Here is the dataset result in the report table:

I don’t know where 205 data is coming from, seems like data from when I first started testing this project. Is there something preventing the report keys from getting updated data? The dataset binding is correct, but it’s not updating the data the report is seeing??? I modified the dataset query after I added it to the report. Do I have to some how remove the dataset key from the report and re-add it to get it to update?