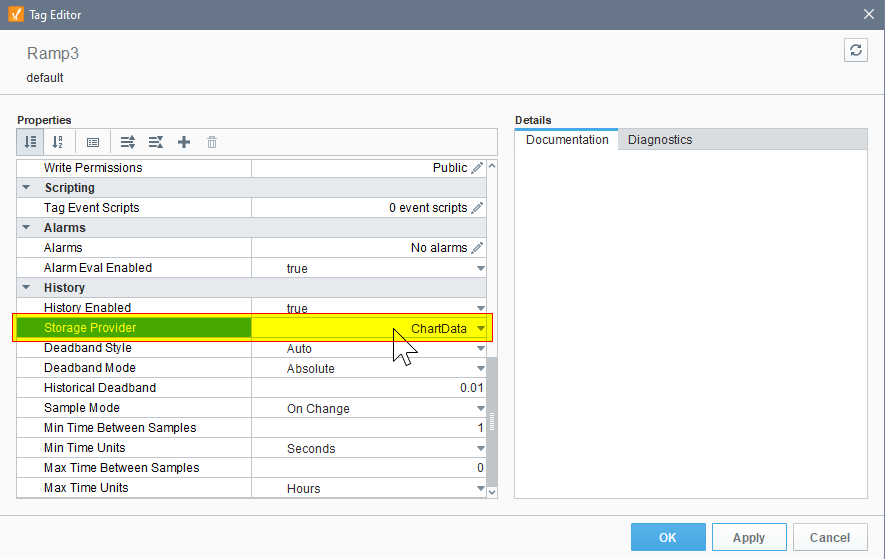
I have a float tag in a UDT, I want to display a time series chart in perspective with this tag. I configured the component series/data/Tag History with the tag, and make sure the tag HistoryEnabled bit is true, But the time series chart display me a graph of zero (which is not what I can see from the tag browser). is there anything I missing for configuration? Thanks!