Do you have any aprox. release date that we could use for reference?
Your module actually have a lot of potential in some of our current projects.
Is ok if not!
Do you have any aprox. release date that we could use for reference?
Your module actually have a lot of potential in some of our current projects.
Is ok if not!
Hopefully 10th July or sooner.
We fixed the execution JavaScript code in eCharts for all props like renderItem and formatter.
I also add some example of using this on playground project which is installed with module for the reference. You can download it and try it now.
Note: In some of the eCharts example they define and call another function inside the renderItem. In this cases you need to bring those function definition inside your JS code.
Current Issues
1. The renderItem JavaScript code only run one time when the charts is loaded so any changes in the series data will not trigger the renderItem. To solve this issue I need to add a component function to refresh and update charts. So each time your binding have new data, you need to call that function to update the chart.
2. Charts which created with renderItem doesn't scale vertically.
All issues are fixed in v0.1.51.
Trully amazing! ![]()
I'll try it now
Hello, interesting module. I have a question is it possible to use formatter for chart axes?
[
  {
    "axisLabel": {
      "formatter": "{value} kW"
    },
    "scale": true,
    "splitLine": {
      "show": false
    },
    "type": "value"
  }
]
I mean {value} 1200 shows as "1,200" and could I set "1 200"?
Best regards,
Michał Góralczyk
Of course anything is possible if you are good at JS. Use following code in yAxis object:
yAxis: {
    type: 'value',
    axisLabel: {
      formatter: function (value) {
      return value.toString().replace(/\B(?=(\d{3})+(?!\d))/g, ' ') + ' kW';
    }
    }
  }
To best way to test this javascript code is goto echarts example page and edit code online and check the result if it is Ok, just copy and paste it into Perspective.
Also, if you install the latest version, I add a view full of this kind examples in demo project. page
I understand. I tried doing it, and the formatter is treated as a string. Can you explain what I'm doing wrong? I thought it wasn't working, hence my question.
Test.zip (31.3 KB)
Oh, it seems you use the old version.
Please download the new version from the site.
The new update which support JavaScript, doesn't have trail logo on the components anymore.
Wow looks really good, this is what I was looking for!
Here is a good example of using JavaScript in rentemItem to create complex charting system.
This is Time-Correlated Events and Metrics chart which is synchronized the Gantt charts with the line chart in x-axis and all zoom and pan action will effect on both of them. I use rentemItem to create gantt data graphical element.
You can find this example in demo project.
selectchanged and dataZoom event.Looks great, Nader, love that calendar start/end dates picker too ![]() Although the quality of your projects make me wonder if I'm in the right line of work
Although the quality of your projects make me wonder if I'm in the right line of work ![]() (I don't think mine are too shabby, but if you compare them to yours, they're left in the dust haha)
(I don't think mine are too shabby, but if you compare them to yours, they're left in the dust haha)
Thank you for your kind message! I'm glad to hear you enjoy it.
We are going to add global onDrag and onDrop event for all components.
I am planning to migrate Ignition 8.1 to 8.3. Will this module work on that version? So far, after the migration, only these messages are visible.
Not yet, but we will soon compile it so it compatible with 8.3.
Thank you so much for the help
We’re excited to announce vCortex 0.1.55 (Ignition 8.1), packed with major improvements, new customization options, and better performance for your projects!
Updated the internal eCharts library to the latest v6 release. Includes new chart types, improved rendering, and overall better compatibility.
Added fresh demo charts showcasing v6 capabilities in the vCortex demo project.
Reduce module runtime size reduced by ~50%. This reduce project resources and having faster project startup.
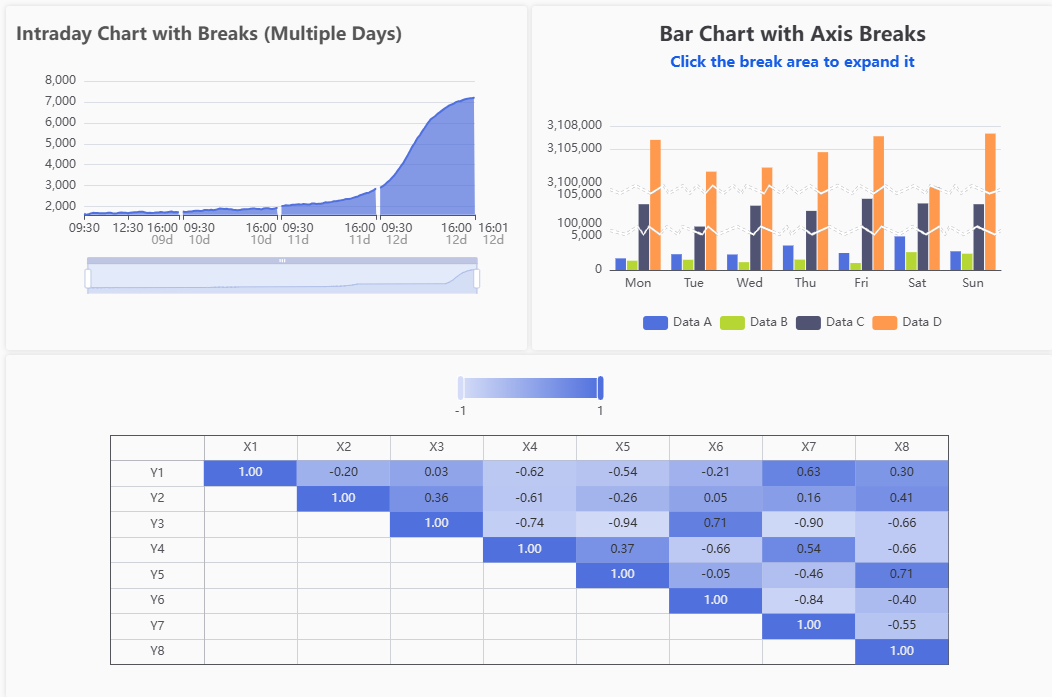
Add runJS() function to the eCharts component to run custom JavaScript code for directly invoking the eCharts API. This allows updating large chart datasets directly in the chart without passing them through props, to improving performance. This is specially important in designer to prevent designer from crashing. We tested up to 1M points! Please refer to Documentation - Apache ECharts for all available API.
Add renderer option to eCharts for canvas and SVG. Canvas: Faster performance and better for large data sets. SVG: Sharper graphics and easier to export or style with CSS and lower memory for mobile devices, but may be slower with complex charts.
Add noMerge option to eCharts. When enabled, the chart will be fully re-rendered each time setOption is changed, instead of merging new options with the existing configuration. Use this when your data structure changes significantly or you want to reset the chart state on update.
Add useDirtyRect option to eCharts. When enable with the Canvas renderer, the dirty rectangle rendering technique detects and updates only the parts of the view that have changed, rather than any changes causing a complete redraw of the canvas.
Add lazyUpdate option to eCharts. Defers chart updates to the next animation frame instead of updating immediately. Helps with smoother performance on complex dashboards.
Add initValue to the Odometer to set the starting number shown when the component first loads. This value is used only on initialization; later updates use the props.value.
We’re excited to announce that vCortex is now fully compatible with Ignition 8.3!
Along with this update, we’re also change our versioning system:
As we introduce Ignition 8.3 support, we are change our versioning system to make it clearer and more consistent across releases. This update will help users easily identify which Ignition version a release targets and how many components are included in the module.
MAJOR.MINOR.PATCH
0 → Ignition 8.1.x
1 → Ignition 8.3.x
Changelog (v0.13.56, v1.13.56):
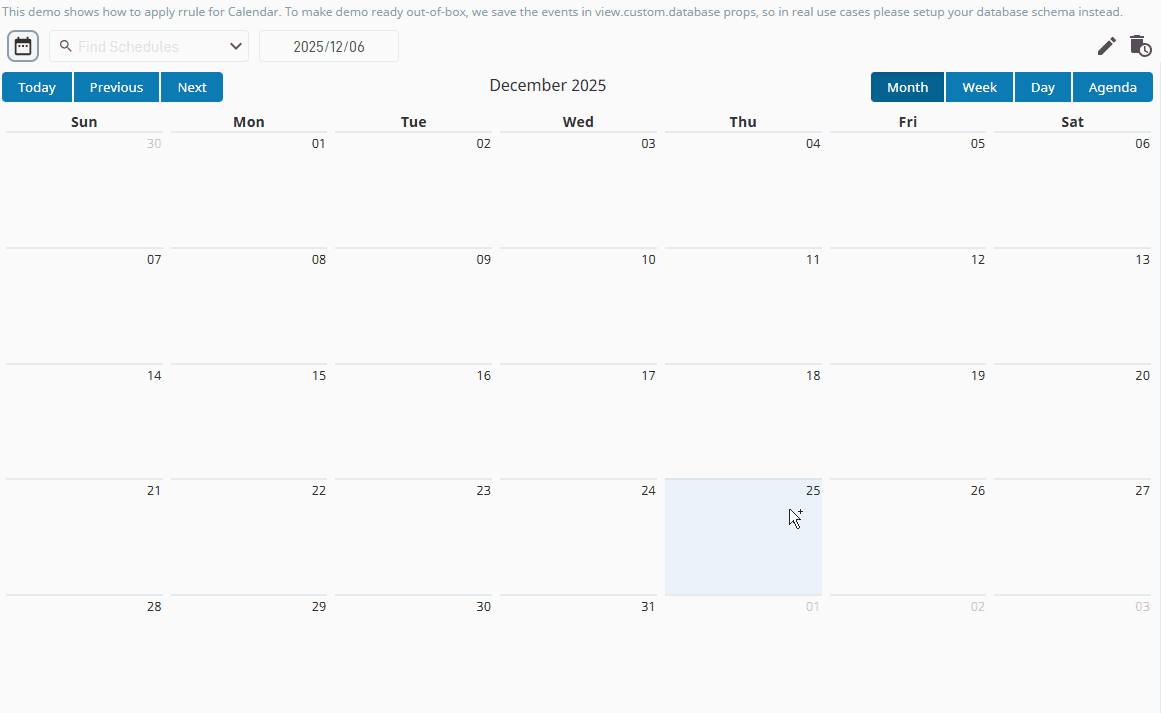
Fixed return index value issue in events of the Calendar component.
Added pagination to the Calendar component to improve UI performance when handling a large number of events.
Added an enabled property to Calendar events. Users can now disable specific events and define the disabled style via style.eventDisabled.
Added hover mode for Calendar events, displaying the event’s startDate and endDate on mouse hover.
Added recurring, rrule, and text properties to the Calendar event schema. Developers can use the recurring and rrule properties to implement custom recurrence logic. The rrule property can be processed via Ignition Python scripts to generate recurring events.
Fixed a bug in the Calendar where moving one of several events with the same ID caused all related events to move together.
Improved components resource loading. JavaScript and CSS files are now modularized per component to reduce project startup load. Only the resources for components actually used in the project are now loaded, minimizing initial runtime load time.
Added a Scheduler page to the demo project to demonstrate how to implement recurring logic in the Calendar.
Note: Those who already installed the older version of module in 8.3 please uninstall the module, reset the gateway and install the new version and restart again, otherwise the changes doesn’t apply.
Great news! Where can I find the i4Cortex module version for Ignition 8.3 to test it?