I have built this grouped simple conveyor object consisting of the half-round belt endpieces and the belt top and bottom as well as 5 rollers:

What I am not able to find are two things:
- How position the group at say 20 degrees for an incline conveyor
- How to color the belt (all the parts that are white right now). I know how to do a tag binding for each individual part, but I'm hoping for something more efficient.
Thanks for your help.
For the belt colour, I would bind to the conveyor's status tag (ideally this will be a string: "Stopped", "Running", etc.) on a custom prop on the group. Then you can either create a new custom prop on the group with the colour for all and then bind the belt sections' colours to this, or you can copy the bindings to each of the belt's sections. Or, you could combine the belt sections together into a single path and then just bind the colour in one.
Where the status as a string is very useful is in abstracting away the integer values of the status, and simply using common strings. Then in a tag dataset you can define the common strings and their associated colours:
This is Perspective, but you can do something similar for Vision by adding another colour-typed column. To get the colour into a property binding, you can use the lookup function:
lookup({view.custom.status}, {[default]System/Datasets/Styling/Device Status}, color(0,0,0), 'Value', 'VisionFill')
The only sane way I've found to adjust the position of grouped items is to ungroup them, move them to where they are needed, and regroup them. In my experience, attempting to manipulate grouped items while they are still grouped tends to cause unexpected behaviors.
For something like this, I find it fun to just draw everything in a templatized paintable canvas. You can add custom properties for angles, line thickness, colors, etc, and make the canvas do literally whatever you want.
Here is an example I made for your use case:
Result:

Result:
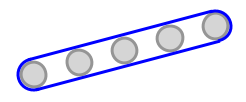

Result:


Here is the template, in case you want to import it and develop it further:
conveyor.zip (12.1 KB)
This is the way.
Sometimes you have to just script the graphics generation for an object like this.
Wow justinedwards.jle, thank you for this! Off to learn about paintable canvas and template importing. Have a hunch that a lot of the things I'm looking for might be found there.
Hello Justin, would you be able to enlighten me how the roller outline is drawn?
I see you first create the rollers, then you paint the rollers based on the color selection. Then you darken the outline of the rollers. That is what I have trouble understanding: I don't see anywhere that the outline thickness (appears to me like 3 pixel) is specified. How does that happen?
Ah, I think I got it, The line thickness is specified further up with the belt thickness: g.setStroke(BasicStroke(beltThickness)). Then everything that is drawn uses this as a stroke, right?
Full Paintable Canvas Script
from java.awt.geom import AffineTransform, Ellipse2D
from java.lang import Math
from java.awt import BasicStroke
# Create a graphics object
g = event.graphics
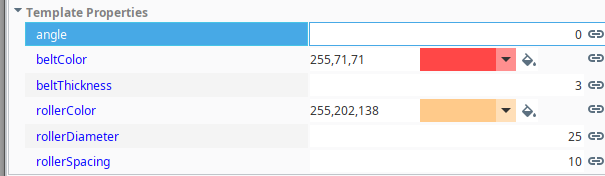
# Define basic variables using template parameters
angle = event.source.parent.angle
beltColor = event.source.parent.beltColor
rollerColor = event.source.parent.rollerColor
beltThickness = event.source.parent.beltThickness
diameter = event.source.parent.rollerDiameter
rollerSpacing = event.source.parent.rollerSpacing
# Define calculated variables for positioning
centerX = int(event.width * 0.5)
centerY = int(event.height * 0.5)
radius = int(diameter / 2)
centerRollerX = centerX - radius
standardOffset = radius + diameter + rollerSpacing
# Set the angle of the conveyor and thickness of the belt
g.transform(AffineTransform.getRotateInstance(Math.toRadians(-angle), centerX, centerY))
g.setStroke(BasicStroke(beltThickness))
# Create the rollers
roller1 = Ellipse2D.Float(centerRollerX - (2 * standardOffset), centerY - radius, diameter, diameter)
roller2 = Ellipse2D.Float(centerRollerX - standardOffset, centerY - radius, diameter, diameter)
roller3 = Ellipse2D.Float(centerRollerX, centerY - radius, diameter, diameter)
roller4 = Ellipse2D.Float(centerRollerX + standardOffset, centerY - radius, diameter, diameter)
roller5 = Ellipse2D.Float(centerRollerX + (2* standardOffset), centerY - radius, diameter, diameter)
# Paint the rollers
g.setColor(rollerColor)
g.fill(roller1)
g.fill(roller2)
g.fill(roller3)
g.fill(roller4)
g.fill(roller5)
# Outline the rollers with a slightly darker color
g.setColor(rollerColor.darker())
g.draw(roller1)
g.draw(roller2)
g.draw(roller3)
g.draw(roller4)
g.draw(roller5)
# Define the calciated coordinate parameters for the conveyor belt
topLeftX = int(roller1.x + (roller1.width / 2))
topLeftY = int(roller1.y) - beltThickness
topRightX = int(roller5.x + (roller5.width / 2))
topRightY = int(roller5.y) - beltThickness
bottomRightX =int(roller5.x + (roller5.width / 2))
bottmRightY = int(roller5.y + roller4.width) + beltThickness
bottomLeftX = int(roller1.x + (roller1.width / 2))
bottomLeftY = int(roller1.y + roller1.width) + beltThickness
# Draw the conveyor belt
g.setColor(beltColor)
g.drawLine(topLeftX, topLeftY, topRightX, topRightY)
g.drawArc(topRightX - radius - beltThickness, topRightY, diameter + (2 * beltThickness), diameter + (2 * beltThickness), -90, 180)
g.drawLine(bottomLeftX, bottomLeftY, bottomRightX, bottmRightY)
g.drawArc(topLeftX - radius - beltThickness, topLeftY, diameter + (2 * beltThickness), diameter + (2 * beltThickness), 90, 180)
Yes, the line thickness is specified in this line here:
beltThickness = event.source.parent.beltThickness
It gets its integer from a custom property called beltThickness that I added to the template.
In the script, I also use it to specify the outline around the rollers, so the belt position is offset relative to the roller positions by that amount to keep everything from overlapping.
