What is the proper way to format query data for Report Tables?

I have an SQL query, it grabs all the daily test data from all the test lines for a date. The query works and grabs all the data I need, I can even get it on a Report in chronlogical order.

shiftdate,
time_produced,
TLC,
BLC,
linecode,
InitialWgt1,
InitialWgt2,
EndWgt1,
EndWgt2,
AvgWgt1,
AvgWgt2

I’m not pulling from multiple databases, all the data I need is there from one query.

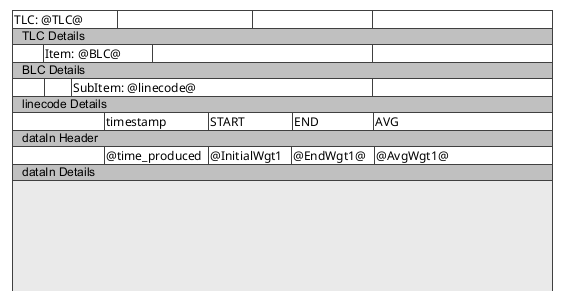
I need to take the data and split the data from the selected date into reports grouped by TLC, then split the TLC into pages for each different item and have them in pdf or printable format

This would be an example of the data grabbed from the database:
All the reports would be for the selected date.
Date 8/28/25

There would be a report just for this TLC but split up into pages for each subItem. So 2 pages.
TLC: G5BE013A
ITEM:1
SUBITEM:A
time_produced
WGT1:60
WGT2:80
WGT3:95
WGT1_INSPEC:0
WGT2_INSPEC:1
WGT3_INSPEC:1
...
ITEM:1
SUBITEM:B
time_produced
WGT1:143
WGT2:216
WGT1_INSPEC:1
WGT2_INSPEC:1
...
ITEM:2
time_produced
WGT1:83
WGT2:116
WGT1_INSPEC:1
WGT2_INSPEC:1
...

It would look like this but separated by TLC, then by item.

Right now they’re all listed one after another. The “Time Produced” 2350 enteries are sub items from one item.

I’ve watched the videos on Table Header, Details, and Summary Rows Video at Inductive University

It feels like maybe Dataset Grouping or Table Grouping - Child Table videos were the closest to what I need but all my data is already grouped into one dataset.

This seems like it should be relatively easy and I’m missing something if I could get some help. Thanks.

I threw this together to get you started. It may not be exactly what you want, but again , just to get you started.

Using a scripted data source in the report:

	
	headers = [
		'shiftdate',
		'time_produced',
		'TLC',
		'BLC',
		'linecode',
		'InitialWgt1',
		'EndWgt1',
		'AvgWgt1'
	]
	
	rows = [
		['8/28/2025','04:00:00','G5BE013A','1','A',60,80,70],
		['8/28/2025','04:15:00','G5BE013A','1','B',140,160,150],
		['8/28/2025','04:30:00','G5BE013A','2','A',140,160,150]
	]
	
	data['dataIn'] = system.dataset.toDataSet(headers, rows)

Here is the page layout

grouping below, dataIn has Header and Details the rest just Details checked. For the BLC grouping, Page Break is selected.

Result:

page 1

page 2

3 Likes

Wow thank you for the great response. I’ll try it out!

Thanks so much. I was able to get the data displaying how I wanted.

I’m trying to add a graph at the bottom using the @AvgPct@ from my list, but it’s showing two data points for each X 1-19 on the chart. One is for item1 (Mushrooms) and the other is for item2 (Onions).

I have the chart in the AllItems Summary section of the table.

I’m using SampleNum which has the correct number of samples taken, 19 as my Domain Key.
AvgPct is the number shown on the right column of the table directly above the chart. AllItems is my only data source.

In my experience, I always have a separate data source for charts to make sure it gets the exact data and format it needs to render the way I want. Review the dataset structuring needed for the chart in the user manual carefully.

I already have a second data source but I’ve having trouble getting just the data for the current page.

I thought I would have been able to grab data from the first datasource for a filter value for the next.

I can test it by manually entering a string into the selected_item value. But I can’t get data from the First Datasource.

I have the chart in the Summary row and I added @Item@ as a test to that row and I can see that.

The Chart shown is using a string ‘Mushrooms’ right now as I can’t figure out how to get @Item@ in the chart.

Is there a way to use the first Datasource “AllItems” values in the second? @Item@ and @AllItems.Items@ doesn’t work, which is all I would need for this second query.

I don’t think you can filter the data source this way. I think you’ll need to remove the ChartData source and add it as a nested query to AllItems. What this will do is run the ChartData query once per key in the parent query, which should do the filtering that you want.

Nested Queries | Ignition User Manual

1 Like

Alright, I’ll try that. Thank you.

If there are DB performance reasons to collect all the chart data in one query, consider constructing the required nesting in a script data source. Like so:

1 Like

There’s no reason it has to be collected all in one query. I just did one query and grabbed all the data did null checking and percentage calculating all in the SQL query. I guess I don’t know a better way.

I guess I’m still trying to understand how everything is linked in the report.