Which chart select to display non-timestamp series

Hello,

I am getting from a query this values, and after split them, I am getting a Dataset for each A,B and C with 6x1 dimension. A and B are the Y values for two lines in the graph, and C is the X axis. Both A and B, matches the C value.
A=0 9.15 9.16 9.15 9.16 9.16
B=0 0 9.06 9.06 9.06 9.07
C=0 77 254 432 610 787

So i am trying to create a graph, but I am stuck in which one select, because power chart is oriented to time series as far as i understand, and X-Y graph seems no work in the desired way, or at least i am not capable to do that.
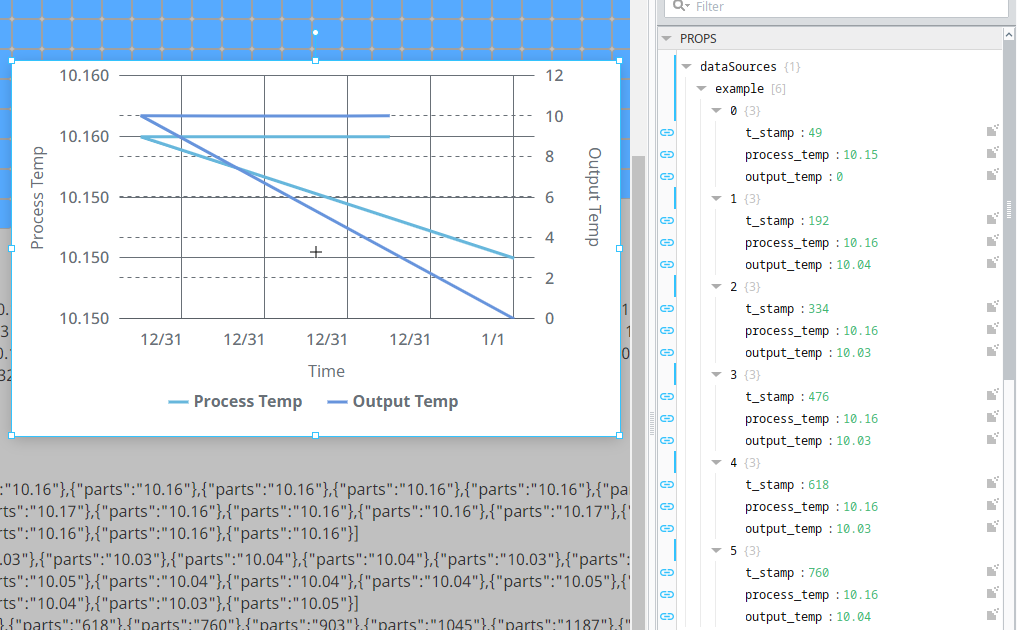
This is what I am getting:

Do anyone knows how to get that?

Thank you!

You should not put a binding on every element in the array.
Put one on the example that fills the whole array.

For me its easier to do in your way, but how do I match the element A0,A1...With C0,C1...?
And just for me to know, what is the problem in doing that? Overload the system? As you can see, i am learning on this.

Thank you!

Array properties are not ordered.
Array bindings use indexes.
which means the bindings might be selecting a different element than you expect

and idk i dont understand your question, the data you show does not match anything in the chart

C= t_stamp? dont let that axis render as date, turn x-axis.render to value i guess

Thats the point, the data in the chart does not match anything in the chart, may be because it is formatted as date? Idk.
My problem is A,B and C are query fields dates, but they are a string, so I have created separated dataset with split function.
So, the point is creating a new dataset containing A and C, and B and C to represent both graphs.

Your data should be something on the order of:

[
    {
        A: 0.0, 
        B: 0.0, 
        C: 0
    }, 
    {
        A: 9.15, 
        B: 0.0, 
        C: 77
    }, 
    {
        A: 9.16, 
        B: 9.06, 
        C: 254
    }, 
    {
        A: 9.15, 
        B: 9.06, 
        C: 432
    }, 
    {
        A: 9.16, 
        B: 9.06, 
        C: 610
    }, 
    {
        A: 9.16, 
        B: 9.07, 
        C: 787
    }
]

I'f I'm reading your first post correctly, your underlying data is already like this from your query. Do you have a sample of that unaltered query data you can share?

Hello,

The problem comes from the source data. Data is formatted as a string with blank spaces:

So, what I made is take each column separated, and make "Trim" in each space, generating 3 different dataset, but that makes impossbiel to plot it in XY chart since they are separated dataset.

jikes, where does this come from?

SQL table

why not store it as array?

Do you mean prior to save in the SQL?
I can not change the format of the data in the SQL.
It comes from another software and is not available to edit unfortunatly.

What does the data in each column from the table really represent?

sigh xd

something like this then i guess

A= "0 0 14"
B= "0 0 14"
C= "0 0.5 14"

splitA=A.split()
splitB=B.split()
splitC=C.split()

shortestLength = len(min([splitA,splitB,splitC],key=len))
returnList=[]
for x in range(shortestLength):
    returnList.append({"A":float(splitA[x]),"B":float(splitB[x]),"C":float(splitC[x])})
return returnList

returns

[{'A': 0.0, 'B': 0.0, 'C': 0.0}, {'A': 0.0, 'B': 0.0, 'C': 0.5}, {'A': 14.0, 'B': 14.0, 'C': 14.0}]
> 
2 Likes

One column is for the maxium diameter of a piece
The other is for the minimum diameter.
The third column represent the position in the piece.

I will check it, thank youuuu!

Not really here nor there, but I would do it like this, probably a little less readable for those newer to python, but it avoids the calculation of the length, zip will automatically only return groups to the length of the shortest iterable passed to it.

from intertools import chain

A = '0 0 14'
B = '0 0 14'
C = '0 0.5 14'

return [dict(zip('ABC',map(float,c))) for c in chain(zip(A.split(),B.split(),C.split()))]

Returns

[{'A': 0.0, 'B': 0.0, 'C': 0.0}, {'A': 0.0, 'B': 0.0, 'C': 0.5}, {'A': 14.0, 'B': 14.0, 'C': 14.0}]
1 Like

i think you are missing some ) ) here

1 Like

Yeah, smh I was rushing to get that posted before I went to take care of an issue. :joy: