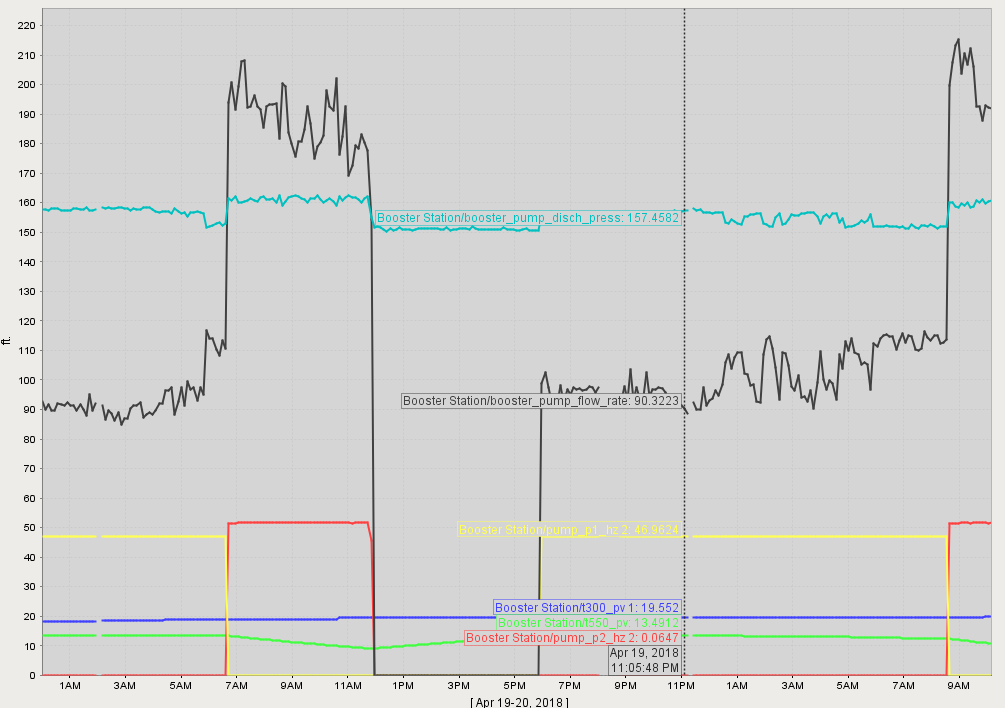
Recently I was looking at one of my EasyCharts and noticed that when using X-Trace mode its exhibiting behavior that seems weird but may be normal. Here is what the chart looks like normally with X-Trace activated:
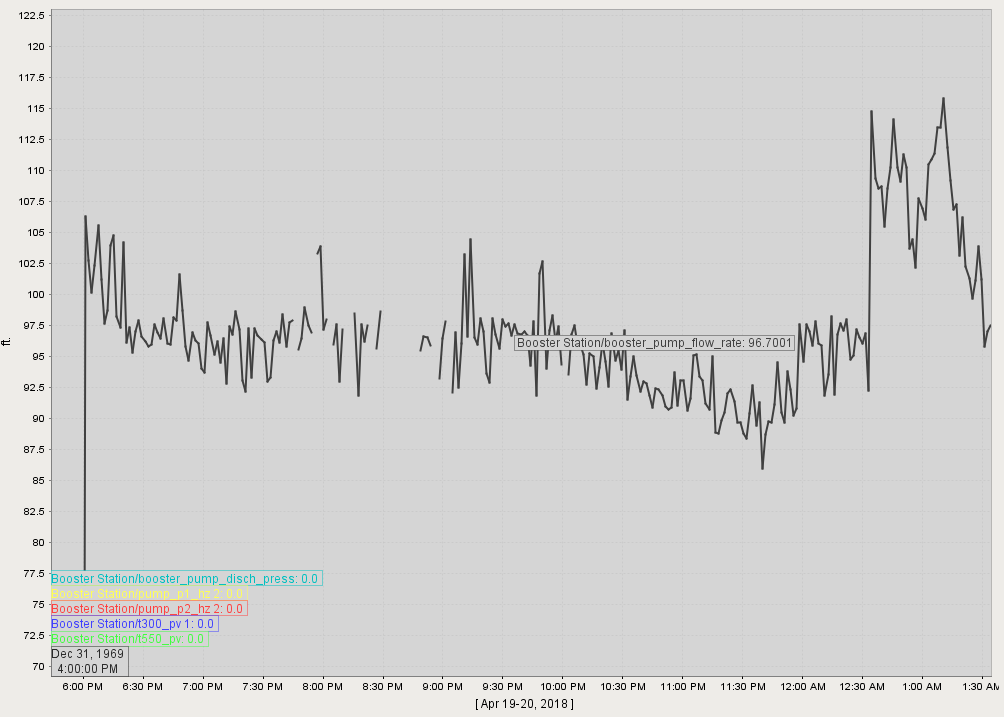
The problem seems to be when I zoom in using X-Trace it A) Shows all the other pens clumped into the lower left hand corner, B) Doesn’t show my X-Trace line, C) Doesn’t show the time for the location I have picked, instead I get Dec 31, 1969 at 4:00:00 PM in the lower left hand corner:
Is this normal behavior or am I missing a setting or something? I’ve noticed it on some of my other charts, but not all of them, and they all seem to be configured the same, wit the exception of the pens. Thanks for any input.