Good morning,
I'm using an XY Chart in Perspective, I wonder if and how could be reach the result of setting a different line width and dashArray of the grid as shown in the attached image
Thank you
Do you want to increase the width of grid?
I would like to increase the width of the grid only on specific rows as shown in the image, this could allowed me to "separate" some items.
You can't modify the grid. But you could add additional straight line plots and set the style as required. For an XY Chart you only need to supply two points for each line - left and right.
You might need to order the plots in the correct sequence so that the "grid" plots are behind the data plots.
I'm not sure I understood correctly—are you saying to add new points in order to create a straight line? In that case, isn't having a configuration like the one in the attached photo a problem? Right now I'm creating horizontal columns serie, so if I were to create two points, wouldn't they start from the hypothetical center of the column instead of overlapping the grid?
Post the formatted chart component JSON for your question and annotate your image so we know exactly what you're trying to achieve. That way we can copy and reproduce your configuration and edit it. Please see Wiki - how to post code on this forum.
Next week I will provide a JSON example, thanks for the help and have a nice weekend.
Good morning guys, this is the JSON that I'm using now.
[
{
"type": "ia.chart.xy",
"version": 0,
"props": {
"title": {
"appearance": {
"font": {
"size": "20px",
"weight": 1
},
"padding": {
"bottom": 5
}
}
},
"legend": {
"enabled": false,
"labels": {
"text": ""
}
},
"cursor": {
"series": "Rotture",
"lineX": {
"stroke": {
"color": "#5CA1F5",
"opacity": 1,
"dashArray": "''"
}
},
"lineY": {
"stroke": {
"color": "#5CA1F5",
"opacity": 1,
"dashArray": "\""
}
}
},
"enableTransitions": true,
"scrollBars": {
"horizontal": {
"enabled": false,
"series": "Rotture"
},
"vertical": {
"enabled": false,
"series": "Rotture"
}
},
"selection": {
"enabled": true,
"selectedHighlightColor": "black"
},
"background": {
"render": "color",
"color": "#666666"
},
"xAxes": [
{
"name": "xAxis",
"label": {
"enabled": false,
"text": "Time",
"color": ""
},
"visible": true,
"tooltip": {
"enabled": true,
"text": "",
"cornerRadius": 3,
"pointerLength": 4,
"background": {
"color": "",
"opacity": 1
}
},
"inversed": false,
"render": "date",
"category": {
"break": {
"enabled": false,
"startCategory": "",
"endCategory": "",
"size": 0.05
}
},
"date": {
"baseInterval": {
"enabled": true,
"timeUnit": "minute",
"count": 1,
"skipEmptyPeriods": false
},
"range": {
"max": 1750676400000,
"min": 1750647600000,
"useStrict": true
},
"break": {
"enabled": false,
"startDate": "",
"endDate": "",
"size": 0.05
},
"inputFormat": "yyyy-MM-dd HH:mm:ss",
"format": "HH:mm d/M"
},
"value": {
"range": {
"max": "",
"min": "",
"useStrict": false
},
"logarithmic": false,
"break": {
"enabled": false,
"startValue": 0,
"endValue": 100,
"size": 0.05
},
"format": "#,###.##"
},
"appearance": {
"opposite": false,
"inside": false,
"labels": {
"color": "white",
"opacity": 0.8,
"rotation": 0,
"verticalCenter": "middle",
"horizontalCenter": "middle",
"wrap": true
},
"grid": {
"color": "white",
"opacity": 0.3,
"dashArray": "",
"minDistance": 90,
"position": 0
},
"font": {
"size": "15px",
"weight": 0,
"textAlign": "center"
}
}
}
],
"yAxes": [
{
"name": "yAxis",
"label": {
"enabled": false,
"text": "",
"color": ""
},
"visible": true,
"tooltip": {
"enabled": true,
"text": "",
"cornerRadius": 3,
"pointerLength": 4,
"background": {
"color": "",
"opacity": 1
}
},
"inversed": true,
"render": "category",
"category": {
"break": {
"enabled": false,
"startCategory": "",
"endCategory": "",
"size": 0.05
}
},
"date": {
"baseInterval": {
"enabled": false,
"timeUnit": "hour",
"count": 1,
"skipEmptyPeriods": false
},
"range": {
"max": "",
"min": "",
"useStrict": false
},
"break": {
"enabled": false,
"startDate": "",
"endDate": "",
"size": 0.05
},
"inputFormat": "yyyy-MM-dd kk:mm:ss",
"format": "M/d/yyyy HH:mm:ss"
},
"value": {
"range": {
"max": "",
"min": "",
"useStrict": false
},
"logarithmic": false,
"break": {
"enabled": false,
"startValue": 0,
"endValue": 100,
"size": 0.05
},
"format": "#,###.##"
},
"appearance": {
"opposite": false,
"inside": false,
"labels": {
"color": "white",
"opacity": 0.8,
"rotation": 0,
"verticalCenter": "middle",
"horizontalCenter": "middle",
"wrap": true
},
"grid": {
"color": "white",
"opacity": 0.1,
"dashArray": "4.4",
"minDistance": 0,
"position": 0
},
"font": {
"size": "14px",
"weight": 0,
"textAlign": "left"
}
}
}
],
"series": [
{
"candlestick": {
"appearance": {
"deriveFieldsFromData": {
"fill": {
"color": "",
"opacity": ""
},
"stroke": {
"color": "",
"opacity": "",
"width": ""
}
},
"fill": {
"color": "",
"opacity": 1
},
"heatRules": {
"dataField": "",
"enabled": false,
"max": "",
"min": ""
},
"stacked": false,
"stroke": {
"color": "",
"opacity": 1,
"width": 1
}
},
"high": {
"x": "",
"y": ""
},
"low": {
"x": "",
"y": ""
},
"open": {
"x": "",
"y": ""
}
},
"column": {
"appearance": {
"deriveFieldsFromData": {
"fill": {
"color": "colore_colonna",
"opacity": ""
},
"stroke": {
"color": "colore_bordo_colonna",
"opacity": "",
"width": "spessore_bordo_colonna"
}
},
"fill": {
"color": "#000000",
"opacity": 1
},
"heatRules": {
"dataField": "",
"enabled": false,
"max": "#C30909",
"min": "#B0BB2D"
},
"height": 44,
"stacked": false,
"stroke": {
"color": "#000000",
"opacity": 1,
"width": 1
},
"width": 0
},
"open": {
"x": "fromDate",
"y": ""
}
},
"columns": {
"template": {
"column": {
"cornerRadiusBottomLeft": "3px",
"cornerRadiusBottomRight": "3px",
"cornerRadiusTopLeft": "3px",
"cornerRadiusTopRight": "3px"
}
}
},
"data": {
"source": "Rotture",
"x": "toDate",
"y": "labelYaxis"
},
"defaultState": {
"visible": true
},
"hiddenInLegend": false,
"label": {
"text": ""
},
"line": {
"appearance": {
"bullets": [
{
"deriveFieldsFromData": {
"fill": {
"color": "",
"opacity": ""
},
"rotation": "",
"stroke": {
"color": "",
"opacity": "",
"width": ""
}
},
"enabled": false,
"fill": {
"color": "",
"opacity": 1
},
"heatRules": {
"dataField": "",
"enabled": false,
"max": 100,
"min": 2
},
"height": 10,
"label": {
"position": {
"dx": 0,
"dy": 0
},
"text": "{value}"
},
"render": "circle",
"rotation": 0,
"stroke": {
"color": "",
"opacity": 1,
"width": 1
},
"tooltip": {
"background": {
"color": "",
"opacity": 1
},
"cornerRadius": 3,
"enabled": true,
"pointerLength": 4,
"text": "{name}: [bold]{valueY}[/]"
},
"width": 10
}
],
"connect": true,
"fill": {
"color": "",
"opacity": 0
},
"minDistance": 0.5,
"stroke": {
"color": "",
"dashArray": "",
"opacity": 1,
"width": 3
},
"tensionX": 1,
"tensionY": 1
},
"open": {
"x": "",
"y": ""
}
},
"name": "Rotture",
"render": "column",
"stepLine": {
"appearance": {
"bullets": [
{
"deriveFieldsFromData": {
"fill": {
"color": "",
"opacity": ""
},
"rotation": "",
"stroke": {
"color": "",
"opacity": "",
"width": ""
}
},
"enabled": true,
"fill": {
"color": "",
"opacity": 1
},
"heatRules": {
"dataField": "",
"enabled": false,
"max": 100,
"min": 2
},
"height": 10,
"label": {
"position": {
"dx": 0,
"dy": 0
},
"text": "{value}"
},
"render": "circle",
"rotation": 0,
"stroke": {
"color": "",
"opacity": 1,
"width": 1
},
"tooltip": {
"background": {
"color": "",
"opacity": 1
},
"cornerRadius": 3,
"enabled": true,
"pointerLength": 4,
"text": "{name}: [bold]{valueY}[/]"
},
"width": 10
}
],
"connect": true,
"fill": {
"color": "",
"opacity": 0
},
"minDistance": 0.5,
"stroke": {
"color": "",
"dashArray": "",
"opacity": 1,
"width": 3
},
"tensionX": 1,
"tensionY": 1
},
"open": {
"x": "",
"y": ""
}
},
"tooltip": {
"background": {
"color": "",
"opacity": 1
},
"cornerRadius": 3,
"enabled": true,
"pointerLength": 4,
"text": ""
},
"visible": false,
"xAxis": "xAxis",
"yAxis": "yAxis",
"zIndex": 0
}
],
"style": {
"fontFamily": "Noto Sans",
"overflow": "hidden"
},
"dataSources": {
"Rotture": [
{
"toDate": "",
"fromDate": "",
"labelYaxis": "T1"
},
{
"toDate": "",
"fromDate": "",
"labelYaxis": "T2"
},
{
"toDate": {
"$": [
"ts",
192,
1750657977938
],
"$ts": 1750657921047
},
"fromDate": {
"$": [
"ts",
192,
1750657977938
],
"$ts": 1750655520987
},
"labelYaxis": "T3"
},
{
"toDate": {
"$": [
"ts",
192,
1750657977938
],
"$ts": 1750648380937
},
"fromDate": {
"$": [
"ts",
192,
1750657977938
],
"$ts": 1750647721093
},
"labelYaxis": "T4"
}
]
}
},
"meta": {
"name": "XYChart"
},
"position": {
"basis": "320px"
},
"custom": {}
}
]
Good morning, has anyone figured out how to handle this question?
Thanks for your help!
[
{
"type": "ia.chart.xy",
"version": 0,
"props": {
"title": {
"appearance": {
"font": {
"size": "20px",
"weight": 1
},
"padding": {
"bottom": 5
}
}
},
"legend": {
"enabled": false,
"labels": {
"text": ""
}
},
"cursor": {
"series": "Rotture",
"lineX": {
"stroke": {
"color": "#5CA1F5",
"opacity": 1,
"dashArray": "''"
}
},
"lineY": {
"stroke": {
"color": "#5CA1F5",
"opacity": 1,
"dashArray": "\""
}
}
},
"enableTransitions": true,
"scrollBars": {
"horizontal": {
"enabled": false,
"series": "Rotture"
},
"vertical": {
"enabled": false,
"series": "Rotture"
}
},
"selection": {
"enabled": true,
"selectedHighlightColor": "black"
},
"background": {
"render": "color",
"color": "#666666"
},
"xAxes": [
{
"name": "xAxis",
"label": {
"enabled": false,
"text": "Time",
"color": ""
},
"visible": true,
"tooltip": {
"enabled": true,
"text": "",
"cornerRadius": 3,
"pointerLength": 4,
"background": {
"color": "",
"opacity": 1
}
},
"inversed": false,
"render": "date",
"category": {
"break": {
"enabled": false,
"startCategory": "",
"endCategory": "",
"size": 0.05
}
},
"date": {
"baseInterval": {
"enabled": true,
"timeUnit": "minute",
"count": 1,
"skipEmptyPeriods": false
},
"range": {
"max": 1750676400000,
"min": 1750647600000,
"useStrict": true
},
"break": {
"enabled": false,
"startDate": "",
"endDate": "",
"size": 0.05
},
"inputFormat": "yyyy-MM-dd HH:mm:ss",
"format": "HH:mm d/M"
},
"value": {
"range": {
"max": "",
"min": "",
"useStrict": false
},
"logarithmic": false,
"break": {
"enabled": false,
"startValue": 0,
"endValue": 100,
"size": 0.05
},
"format": "#,###.##"
},
"appearance": {
"opposite": false,
"inside": false,
"labels": {
"color": "white",
"opacity": 0.8,
"rotation": 0,
"verticalCenter": "middle",
"horizontalCenter": "middle",
"wrap": true
},
"grid": {
"color": "white",
"opacity": 0.3,
"dashArray": "",
"minDistance": 90,
"position": 0
},
"font": {
"size": "15px",
"weight": 0,
"textAlign": "center"
}
}
}
],
"yAxes": [
{
"name": "yAxis",
"label": {
"enabled": false,
"text": "",
"color": ""
},
"visible": true,
"tooltip": {
"enabled": true,
"text": "",
"cornerRadius": 3,
"pointerLength": 4,
"background": {
"color": "",
"opacity": 1
}
},
"inversed": true,
"render": "category",
"category": {
"break": {
"enabled": false,
"startCategory": "",
"endCategory": "",
"size": 0.05
}
},
"date": {
"baseInterval": {
"enabled": false,
"timeUnit": "hour",
"count": 1,
"skipEmptyPeriods": false
},
"range": {
"max": "",
"min": "",
"useStrict": false
},
"break": {
"enabled": false,
"startDate": "",
"endDate": "",
"size": 0.05
},
"inputFormat": "yyyy-MM-dd kk:mm:ss",
"format": "M/d/yyyy HH:mm:ss"
},
"value": {
"range": {
"max": "",
"min": "",
"useStrict": false
},
"logarithmic": false,
"break": {
"enabled": false,
"startValue": 0,
"endValue": 100,
"size": 0.05
},
"format": "#,###.##"
},
"appearance": {
"opposite": false,
"inside": false,
"labels": {
"color": "white",
"opacity": 0.8,
"rotation": 0,
"verticalCenter": "middle",
"horizontalCenter": "middle",
"wrap": true
},
"grid": {
"color": "white",
"opacity": 0.1,
"dashArray": "4.4",
"minDistance": 0,
"position": 0
},
"font": {
"size": "14px",
"weight": 0,
"textAlign": "left"
}
}
},
{
"name": "heavyGrid",
"label": {
"enabled": true,
"text": "",
"color": ""
},
"visible": true,
"tooltip": {
"enabled": true,
"text": "",
"cornerRadius": 3,
"pointerLength": 4,
"background": {
"color": "",
"opacity": 1
}
},
"inversed": false,
"render": "value",
"category": {
"break": {
"enabled": false,
"startCategory": "",
"endCategory": "",
"size": 0.05
}
},
"date": {
"baseInterval": {
"enabled": false,
"timeUnit": "hour",
"count": 1,
"skipEmptyPeriods": false
},
"range": {
"max": "",
"min": "",
"useStrict": false
},
"break": {
"enabled": false,
"startDate": "",
"endDate": "",
"size": 0.05
},
"inputFormat": "yyyy-MM-dd kk:mm:ss",
"format": "M/d/yyyy HH:mm:ss"
},
"value": {
"range": {
"max": 0,
"min": -4,
"useStrict": false
},
"logarithmic": false,
"break": {
"enabled": false,
"startValue": 0,
"endValue": 100,
"size": 0.05
},
"format": "#,###.##"
},
"appearance": {
"opposite": false,
"inside": false,
"labels": {
"color": "",
"opacity": 1,
"rotation": 0,
"verticalCenter": "middle",
"horizontalCenter": "middle"
},
"grid": {
"color": "",
"opacity": 1,
"dashArray": "",
"minDistance": null,
"position": 0.5
},
"font": {
"size": "",
"weight": 500
}
}
}
],
"series": [
{
"name": "Rotture",
"label": {
"text": ""
},
"visible": false,
"hiddenInLegend": false,
"defaultState": {
"visible": true
},
"data": {
"source": "Rotture",
"x": "toDate",
"y": "labelYaxis"
},
"xAxis": "xAxis",
"yAxis": "yAxis",
"zIndex": 0,
"tooltip": {
"enabled": true,
"text": "",
"cornerRadius": 3,
"pointerLength": 4,
"background": {
"color": "",
"opacity": 1
}
},
"render": "column",
"candlestick": {
"open": {
"x": "",
"y": ""
},
"high": {
"x": "",
"y": ""
},
"low": {
"x": "",
"y": ""
},
"appearance": {
"fill": {
"color": "",
"opacity": 1
},
"stroke": {
"color": "",
"opacity": 1,
"width": 1
},
"stacked": false,
"deriveFieldsFromData": {
"fill": {
"color": "",
"opacity": ""
},
"stroke": {
"color": "",
"opacity": "",
"width": ""
}
},
"heatRules": {
"enabled": false,
"max": "",
"min": "",
"dataField": ""
}
}
},
"column": {
"open": {
"x": "fromDate",
"y": ""
},
"appearance": {
"fill": {
"color": "#000000",
"opacity": 1
},
"stroke": {
"color": "#000000",
"opacity": 1,
"width": 1
},
"stacked": false,
"width": 0,
"height": 44,
"deriveFieldsFromData": {
"fill": {
"color": "colore_colonna",
"opacity": ""
},
"stroke": {
"color": "colore_bordo_colonna",
"opacity": "",
"width": "spessore_bordo_colonna"
}
},
"heatRules": {
"enabled": false,
"max": "#C30909",
"min": "#B0BB2D",
"dataField": ""
}
}
},
"line": {
"open": {
"x": "",
"y": ""
},
"appearance": {
"connect": true,
"tensionX": 1,
"tensionY": 1,
"minDistance": 0.5,
"stroke": {
"width": 3,
"opacity": 1,
"color": "",
"dashArray": ""
},
"fill": {
"opacity": 0,
"color": ""
},
"bullets": [
{
"enabled": false,
"render": "circle",
"width": 10,
"height": 10,
"label": {
"text": "{value}",
"position": {
"dx": 0,
"dy": 0
}
},
"fill": {
"color": "",
"opacity": 1
},
"stroke": {
"color": "",
"opacity": 1,
"width": 1
},
"rotation": 0,
"tooltip": {
"enabled": true,
"text": "{name}: [bold]{valueY}[/]",
"cornerRadius": 3,
"pointerLength": 4,
"background": {
"color": "",
"opacity": 1
}
},
"deriveFieldsFromData": {
"fill": {
"color": "",
"opacity": ""
},
"stroke": {
"color": "",
"opacity": "",
"width": ""
},
"rotation": ""
},
"heatRules": {
"enabled": false,
"max": 100,
"min": 2,
"dataField": ""
}
}
]
}
},
"stepLine": {
"open": {
"x": "",
"y": ""
},
"appearance": {
"connect": true,
"tensionX": 1,
"tensionY": 1,
"minDistance": 0.5,
"stroke": {
"width": 3,
"opacity": 1,
"color": "",
"dashArray": ""
},
"fill": {
"opacity": 0,
"color": ""
},
"bullets": [
{
"enabled": true,
"render": "circle",
"width": 10,
"height": 10,
"label": {
"text": "{value}",
"position": {
"dx": 0,
"dy": 0
}
},
"fill": {
"color": "",
"opacity": 1
},
"stroke": {
"color": "",
"opacity": 1,
"width": 1
},
"rotation": 0,
"tooltip": {
"enabled": true,
"text": "{name}: [bold]{valueY}[/]",
"cornerRadius": 3,
"pointerLength": 4,
"background": {
"color": "",
"opacity": 1
}
},
"deriveFieldsFromData": {
"fill": {
"color": "",
"opacity": ""
},
"stroke": {
"color": "",
"opacity": "",
"width": ""
},
"rotation": ""
},
"heatRules": {
"enabled": false,
"max": 100,
"min": 2,
"dataField": ""
}
}
]
}
},
"columns": {
"template": {
"column": {
"cornerRadiusBottomLeft": "3px",
"cornerRadiusBottomRight": "3px",
"cornerRadiusTopLeft": "3px",
"cornerRadiusTopRight": "3px"
}
}
}
},
{
"name": "heavyGrid",
"label": {
"text": ""
},
"visible": true,
"hiddenInLegend": false,
"defaultState": {
"visible": true
},
"data": {
"source": "gridLines0",
"x": "x",
"y": "y0"
},
"xAxis": "xAxis",
"yAxis": "heavyGrid",
"zIndex": 0,
"tooltip": {
"enabled": true,
"text": "{name}: [bold]{valueY}[/]",
"cornerRadius": 3,
"pointerLength": 4,
"background": {
"color": "",
"opacity": 1
}
},
"render": "line",
"candlestick": {
"open": {
"x": "",
"y": ""
},
"high": {
"x": "",
"y": ""
},
"low": {
"x": "",
"y": ""
},
"appearance": {
"fill": {
"color": "",
"opacity": 1
},
"stroke": {
"color": "",
"opacity": 1,
"width": 1
},
"stacked": false,
"deriveFieldsFromData": {
"fill": {
"color": "",
"opacity": ""
},
"stroke": {
"color": "",
"opacity": "",
"width": ""
}
},
"heatRules": {
"enabled": false,
"max": "",
"min": "",
"dataField": ""
}
}
},
"column": {
"open": {
"x": "",
"y": ""
},
"appearance": {
"fill": {
"color": "",
"opacity": 1
},
"stroke": {
"color": "",
"opacity": 1,
"width": 1
},
"stacked": false,
"width": null,
"height": null,
"deriveFieldsFromData": {
"fill": {
"color": "",
"opacity": ""
},
"stroke": {
"color": "",
"opacity": "",
"width": ""
}
},
"heatRules": {
"enabled": false,
"max": "",
"min": "",
"dataField": ""
}
}
},
"line": {
"open": {
"x": "",
"y": ""
},
"appearance": {
"connect": true,
"tensionX": 1,
"tensionY": 1,
"minDistance": 0.5,
"stroke": {
"width": 3,
"opacity": 1,
"color": "",
"dashArray": ""
},
"fill": {
"opacity": 0,
"color": ""
},
"bullets": [
{
"enabled": false,
"render": "circle",
"width": 10,
"height": 10,
"label": {
"text": "{value}",
"position": {
"dx": 0,
"dy": 0
}
},
"fill": {
"color": "",
"opacity": 1
},
"stroke": {
"color": "",
"opacity": 1,
"width": 1
},
"rotation": 0,
"tooltip": {
"enabled": true,
"text": "{name}: [bold]{valueY}[/]",
"cornerRadius": 3,
"pointerLength": 4,
"background": {
"color": "",
"opacity": 1
}
},
"deriveFieldsFromData": {
"fill": {
"color": "",
"opacity": ""
},
"stroke": {
"color": "",
"opacity": "",
"width": ""
},
"rotation": ""
},
"heatRules": {
"enabled": false,
"max": 100,
"min": 2,
"dataField": ""
}
}
]
}
},
"stepLine": {
"open": {
"x": "",
"y": ""
},
"appearance": {
"connect": true,
"tensionX": 1,
"tensionY": 1,
"minDistance": 0.5,
"stroke": {
"width": 3,
"opacity": 1,
"color": "",
"dashArray": ""
},
"fill": {
"opacity": 0,
"color": ""
},
"bullets": [
{
"enabled": true,
"render": "circle",
"width": 10,
"height": 10,
"label": {
"text": "{value}",
"position": {
"dx": 0,
"dy": 0
}
},
"fill": {
"color": "",
"opacity": 1
},
"stroke": {
"color": "",
"opacity": 1,
"width": 1
},
"rotation": 0,
"tooltip": {
"enabled": true,
"text": "{name}: [bold]{valueY}[/]",
"cornerRadius": 3,
"pointerLength": 4,
"background": {
"color": "",
"opacity": 1
}
},
"deriveFieldsFromData": {
"fill": {
"color": "",
"opacity": ""
},
"stroke": {
"color": "",
"opacity": "",
"width": ""
},
"rotation": ""
},
"heatRules": {
"enabled": false,
"max": 100,
"min": 2,
"dataField": ""
}
}
]
}
}
},
{
"name": "heavyGrid",
"label": {
"text": ""
},
"visible": true,
"hiddenInLegend": false,
"defaultState": {
"visible": true
},
"data": {
"source": "gridLines0",
"x": "x",
"y": "y1"
},
"xAxis": "xAxis",
"yAxis": "heavyGrid",
"zIndex": 0,
"tooltip": {
"enabled": true,
"text": "{name}: [bold]{valueY}[/]",
"cornerRadius": 3,
"pointerLength": 4,
"background": {
"color": "",
"opacity": 1
}
},
"render": "line",
"candlestick": {
"open": {
"x": "",
"y": ""
},
"high": {
"x": "",
"y": ""
},
"low": {
"x": "",
"y": ""
},
"appearance": {
"fill": {
"color": "",
"opacity": 1
},
"stroke": {
"color": "",
"opacity": 1,
"width": 1
},
"stacked": false,
"deriveFieldsFromData": {
"fill": {
"color": "",
"opacity": ""
},
"stroke": {
"color": "",
"opacity": "",
"width": ""
}
},
"heatRules": {
"enabled": false,
"max": "",
"min": "",
"dataField": ""
}
}
},
"column": {
"open": {
"x": "",
"y": ""
},
"appearance": {
"fill": {
"color": "",
"opacity": 1
},
"stroke": {
"color": "",
"opacity": 1,
"width": 1
},
"stacked": false,
"width": null,
"height": null,
"deriveFieldsFromData": {
"fill": {
"color": "",
"opacity": ""
},
"stroke": {
"color": "",
"opacity": "",
"width": ""
}
},
"heatRules": {
"enabled": false,
"max": "",
"min": "",
"dataField": ""
}
}
},
"line": {
"open": {
"x": "",
"y": ""
},
"appearance": {
"connect": true,
"tensionX": 1,
"tensionY": 1,
"minDistance": 0.5,
"stroke": {
"width": 3,
"opacity": 1,
"color": "",
"dashArray": ""
},
"fill": {
"opacity": 0,
"color": ""
},
"bullets": [
{
"enabled": false,
"render": "circle",
"width": 10,
"height": 10,
"label": {
"text": "{value}",
"position": {
"dx": 0,
"dy": 0
}
},
"fill": {
"color": "",
"opacity": 1
},
"stroke": {
"color": "",
"opacity": 1,
"width": 1
},
"rotation": 0,
"tooltip": {
"enabled": true,
"text": "{name}: [bold]{valueY}[/]",
"cornerRadius": 3,
"pointerLength": 4,
"background": {
"color": "",
"opacity": 1
}
},
"deriveFieldsFromData": {
"fill": {
"color": "",
"opacity": ""
},
"stroke": {
"color": "",
"opacity": "",
"width": ""
},
"rotation": ""
},
"heatRules": {
"enabled": false,
"max": 100,
"min": 2,
"dataField": ""
}
}
]
}
},
"stepLine": {
"open": {
"x": "",
"y": ""
},
"appearance": {
"connect": true,
"tensionX": 1,
"tensionY": 1,
"minDistance": 0.5,
"stroke": {
"width": 3,
"opacity": 1,
"color": "",
"dashArray": ""
},
"fill": {
"opacity": 0,
"color": ""
},
"bullets": [
{
"enabled": true,
"render": "circle",
"width": 10,
"height": 10,
"label": {
"text": "{value}",
"position": {
"dx": 0,
"dy": 0
}
},
"fill": {
"color": "",
"opacity": 1
},
"stroke": {
"color": "",
"opacity": 1,
"width": 1
},
"rotation": 0,
"tooltip": {
"enabled": true,
"text": "{name}: [bold]{valueY}[/]",
"cornerRadius": 3,
"pointerLength": 4,
"background": {
"color": "",
"opacity": 1
}
},
"deriveFieldsFromData": {
"fill": {
"color": "",
"opacity": ""
},
"stroke": {
"color": "",
"opacity": "",
"width": ""
},
"rotation": ""
},
"heatRules": {
"enabled": false,
"max": 100,
"min": 2,
"dataField": ""
}
}
]
}
}
}
],
"style": {
"fontFamily": "Noto Sans",
"overflow": "hidden"
},
"dataSources": {
"Rotture": [
{
"toDate": "",
"fromDate": "",
"labelYaxis": "T1"
},
{
"toDate": "",
"fromDate": "",
"labelYaxis": "T2"
},
{
"toDate": {
"$": [
"ts",
192,
1753638395595
],
"$ts": 1750668721000
},
"fromDate": {
"$": [
"ts",
192,
1750657977938
],
"$ts": 1750655520987
},
"labelYaxis": "T3"
},
{
"toDate": {
"$": [
"ts",
192,
1753638340373
],
"$ts": 1750648680000
},
"fromDate": {
"$": [
"ts",
192,
1750657977938
],
"$ts": 1750647721093
},
"labelYaxis": "T4"
}
],
"gridLines0": [
{
"y0": -1,
"y1": -1.75
},
{
"y0": -1,
"y1": -1.75
}
]
}
},
"meta": {
"name": "XYChart"
},
"position": {
"width": 693,
"height": 383
},
"custom": {},
"propConfig": {
"props.dataSources.gridLines0[0].x": {
"binding": {
"type": "property",
"config": {
"path": "this.props.xAxes[0].date.range.min"
}
}
},
"props.dataSources.gridLines0[1].x": {
"binding": {
"type": "property",
"config": {
"path": "this.props.xAxes[0].date.range.max"
}
}
}
}
}
]
... continued due to character count limit ...
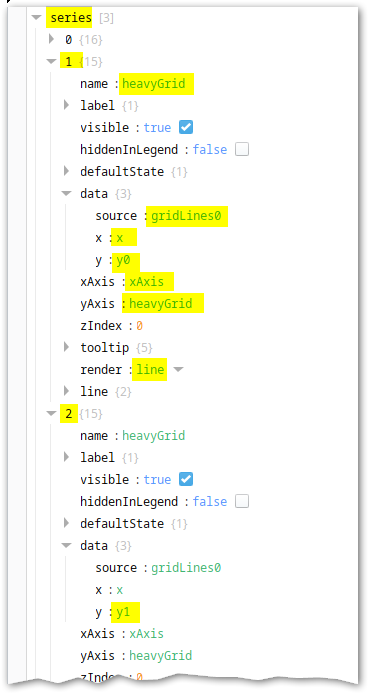
Tricks employed:
heavyGrid.yAxes.1.render : valueyAxes.1.value.range.max : 0xAxes.0.date.range.min and .max.Thanks @Transistor, you're always very helpful.
One question, there's a specific reason why you used number from 0 to -4 and not from 0 to 4 for example?
In the next days I'll try to implement it in the project.
Have a nice day
One question, there's a specific reason why you used number from 0 to -4 ...
Only because T1 is at the top. I thought it might make more sense to have your origin at top left. It doesn't matter but just make it obvious to whoever has to fix or modify it after you!
Thanks @Transistor, you're always very helpful.
Sometimes wrong though! Thanks.