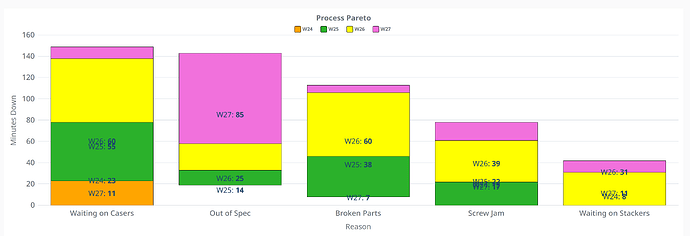
I've checked the forum for someone with the same question but I don't anyone has.
I've got a XY Chart Stacked Bar Chart and I want to display the values on the chart (like the below image). I created an extra series as a line graph and displayed the bullets as labels but this only works for the bottom bar as the other line series aren't stacked and will display with there y relative to the bottom of the chart not the other values.
When I hover over the chart the tooltip displays in the correct locations. I don't think I'm missing anything obvious but if anyone has any ideas or solutions, please point me in the right direction.
Bumping this post.. has anyone found a solution?
amCharts documentation:
I'm thinking you would need to follow the steps in this post, but you'd have to add a new line for each data point / each stack (not just a totalizer amount):
Then you can adjust where the label shows up on your stacked bar chart by adjusting the dx and dy settings.
This might work if you're using a single bar, but stacked makes it messy. It doesn't account for the bars being stacked, so the points end up being based off the value completely unrelated to where the stacked bar is. I didn't even bother trying to use an positioning offset, because my graph is dynamic, so unless you're manually feeding the points in and it'll never change, then you're going to end up with scrambled points if the bars change values.
Honestly, at this point I would be thrilled if the tooltip could just permanently affix itself to each bar without having to hover over it.

