Being having this on and off issue with a client’s install where production data ‘does not add up’. Over the past couple of days, production data transaction records have failed to log to the database. Going online I see the following events in the transaction group:
The trigger is attached to a PLC LineBatchDoneTrigger which is a one shot latch ON from the PLC when new batch data is available to be recorded. It is the error shown here which I don’t completely understand.
This is the configuration:
The error is saying your tag had bad quality at certain times. So because it had bad quality it couldn’t evaluate the trigger nor run the group.
Where is the tag coming from? A device configured in Ignition or a 3rd party OPC server?
What version of Ignition do you have?
[quote=“Travis.Cox”]The error is saying your tag had bad quality at certain times. So because it had bad quality it couldn’t evaluate the trigger nor run the group.
Where is the tag coming from? A device configured in Ignition or a 3rd party OPC server?
What version of Ignition do you have?[/quote]
Travis,
the trigger tag is bound is from a Contrologix PLC using the built in Ignition OPC-UA driver.
the screen shot shows the version 7.3.6 and setup.
Can you send us the logs.bin file located in C:\program files\inductive automation\logs folder?
sure, send to :____________________?
sent the logs.bin GZ file as I cannot directly access the gateway .
I use LogMeIn to connect to a network client. No browsing privileges.
You pretty frequently have read requests being sent to the ‘Calgary Mix Plant’ CLX device that time out. This could easily be the cause of your stale data.
What’s the ‘Communication Timeout’ property for that driver set to?
Is the CLX local to the Ignition gateway or is it remote?
[quote=“Kevin.Herron”]You pretty frequently have read requests being sent to the ‘Calgary Mix Plant’ CLX device that time out. This could easily be the cause of your stale data.
What’s the ‘Communication Timeout’ property for that driver set to?
Is the CLX local to the Ignition gateway or is it remote?[/quote]
Kevin,
This is a private network Mission Ctritical install connected to only 1 Contrologix PLC , 3 PV+ HMIs and 9 Ethernet Scales with no other devices on the private network.
Any communication parameters are the default with Ignition
[quote=“Curlyandshemp”][quote=“Kevin.Herron”]You pretty frequently have read requests being sent to the ‘Calgary Mix Plant’ CLX device that time out. This could easily be the cause of your stale data.
What’s the ‘Communication Timeout’ property for that driver set to?
Is the CLX local to the Ignition gateway or is it remote?[/quote]
Kevin,
This is a private network Mission Ctritical install connected to only 1 Contrologix PLC , 3 PV+ HMIs and 9 Ethernet Scales with no other devices on the private network.
Any communication parameters are the default with Ignition[/quote]
Well I don’t exactly remember the defaults in 7.3.x, so here’s what I would try first:
Increase the ‘Communication Timeout’ setting. It was probably 2000ms by default, try 4000ms.
Increase the ‘Concurrent Requests’ setting. It was probably 2 by default, try 3 or 4.
Run for a few hours/days and see if it makes a difference.
Sorry Kevin,
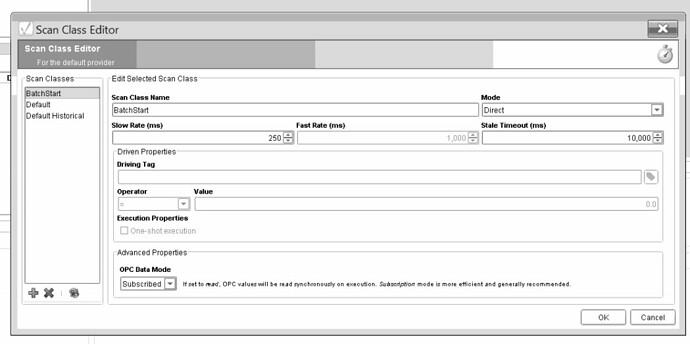
stand corrected, there is one scan class that runs pretty fast:
The default is 1,000ms
I went online and changed timeout from 2000 to 4000
Concurrent connections was set at 10
You can leave it at 10, assuming the CLX has enough connections available. How many they have total depends on the model, but if Ignition is pretty much the only system communicating with it you should be ok.
Which scan class is your trigger tag in - the one that is reporting bad quality and a stale value from time to time?
There are only 3 tags in the fastest scan class:

The BatchDoneTrigger is the one causing the issue, but i noticed Line A is in the default scan class of 1000ms and Line B is at 250ms. Line A should also be in teh fastest scan class.
Line A is the one causing the most issues.
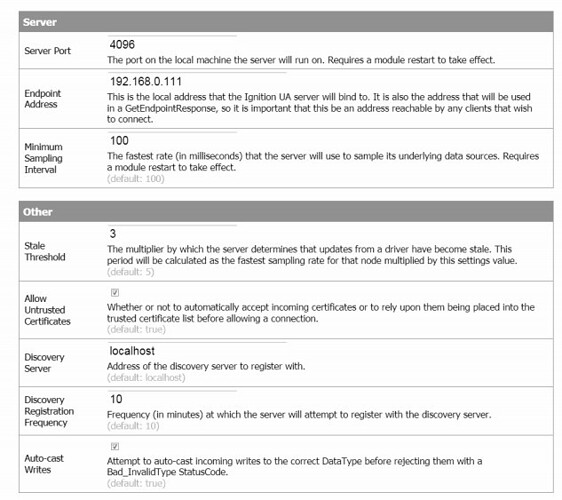
One other setting worth checking the current value of: under the settings for Ignition OPC-UA Server there should be a ‘Stale Threshold’ setting… what’s the value of that?
When dealing with scan classes under 1s it’s relatively useless unless set to something high.
For example, with a 250ms rate and a 2000ms comm timeout, the stale threshold would need to be between 8 and 16 to even give a single timed out 250ms request a second chance to complete before marking the tags as stale.
[quote=“Kevin.Herron”]One other setting worth checking the current value of: under the settings for Ignition OPC-UA Server there should be a ‘Stale Threshold’ setting… what’s the value of that?
When dealing with scan classes under 1s it’s relatively useless unless set to something high.
For example, with a 250ms rate and a 2000ms comm timeout, the stale threshold would need to be between 8 and 16 to even give a single timed out 250ms request a second chance to complete before marking the tags as stale.[/quote]
screen shot of OPC-UA settings
Great.
Crank the Stale Threshold to 15, move the Communication Timeout on the driver down to 1500ms, leave Concurrent Requests at 10, restart the UA module, and report back in a day or so.
[quote=“Kevin.Herron”]Great.
Crank the Stale Threshold to 15, move the Communication Timeout on the driver down to 1500ms, leave Concurrent Requests at 10, restart the UA module, and report back in a day or so.[/quote]
Thanks Kevin,
i will have to do this over the weekend when the customer is not running. I will then let it run for a day or so , then grab another log file.
Thanks for your help
Ian
Changes were done as per recommendations on Friday @ 4:43 MDT , 6:43 EDT 3:43 PDT.
Grabbed log file and emailed to support this AM with subject : “follow Up on logs file “Missing Transaction Records” poested on forum”
Dang, still getting way too many timeouts. I’m not really sure why. There’s not much we can do when a PLC doesn’t respond to a request within the time limit.
It might be interesting to enable SQLTags history on one of the problematic trigger tags and then once we have some history logged that includes the null values with bad quality, go back into the logs and make sure they correlate with instances of the requests timing out.


