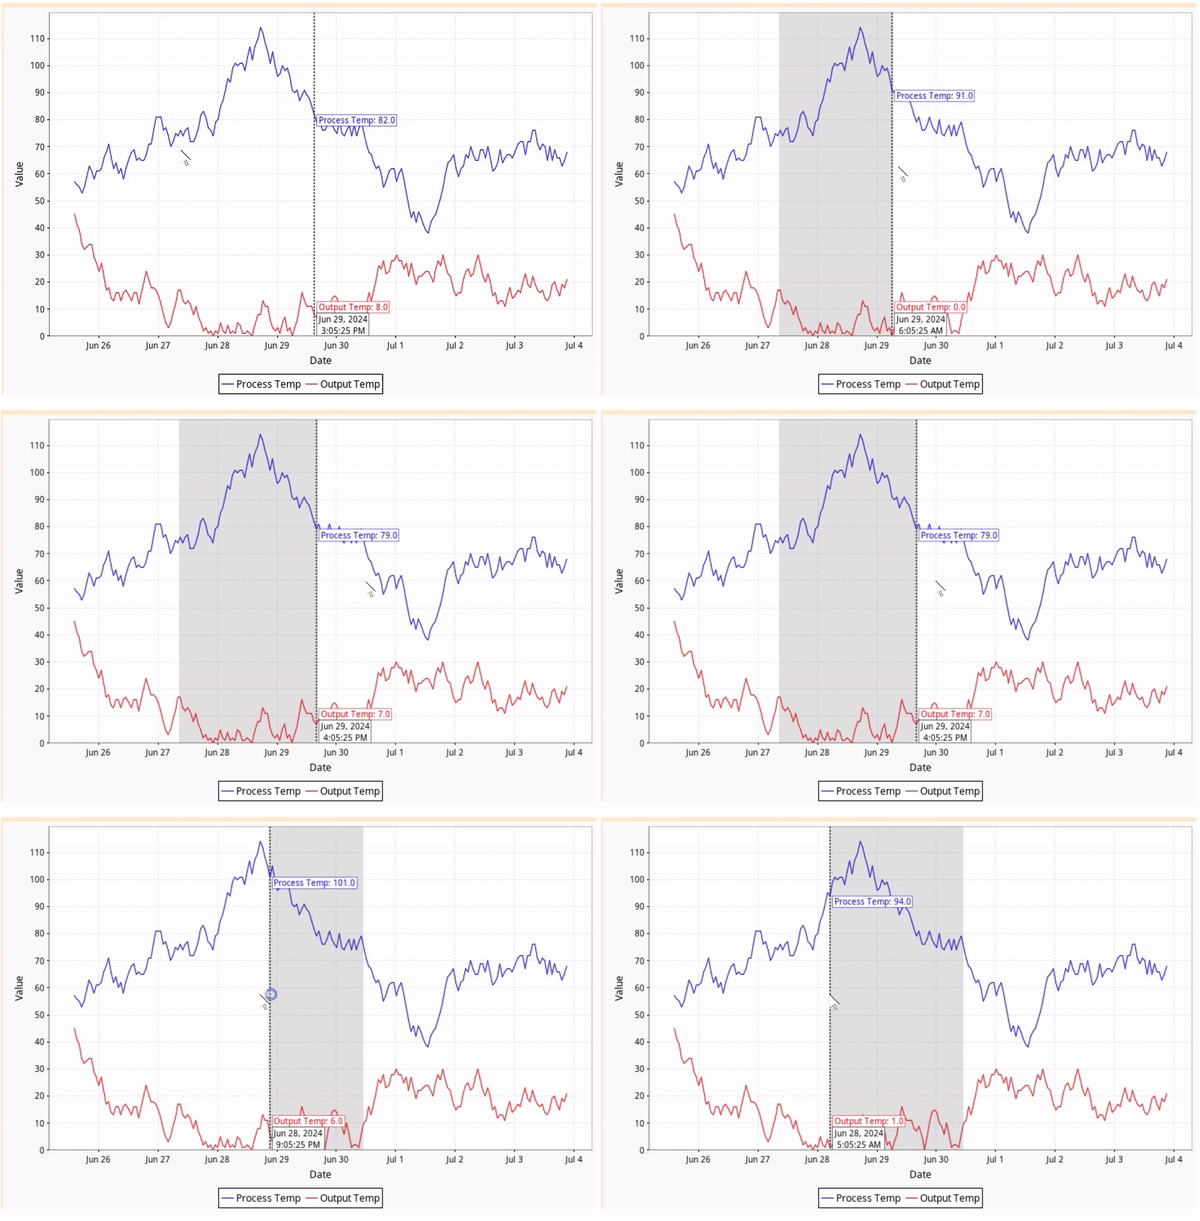
This doesn't seem like it would be that difficult to develop. The chart comes with every mouse event handler, so it's a simple matter of adding an interval marker using the mouse position, and then performing calculations within the interval.
Example:
Start by adding a couple of custom properties to the parent container of the chart to store the start date and end date as millis for the interval marker:

Store the starting point on the mousePressed event:
# Reset the marking process and set a new starting point
event.source.parent.endingPoint == None
event.source.chart.plot.clearDomainMarkers()
dataArea = event.source.chartRenderingInfo.plotInfo.dataArea
event.source.parent.startingPoint = event.source.chart.plot.domainAxis.java2DToValue(event.x, dataArea, event.source.chart.plot.domainAxisEdge)
Use the mouseDragged event handler to store the end point:
# Clear the domain marker, recalculate where it should be, and repaint it on the chart
from org.jfree.chart.plot import IntervalMarker
event.source.chart.plot.clearDomainMarkers()
dataArea = event.source.chartRenderingInfo.plotInfo.dataArea
event.source.parent.endingPoint = event.source.chart.plot.domainAxis.java2DToValue(event.x, dataArea, event.source.chart.plot.domainAxisEdge)

# Flip the starting and ending points of the interval marker if the drag event is moving from right to left
startingPoint = min(event.source.parent.startingPoint, event.source.parent.endingPoint)
endingPoint = max(event.source.parent.startingPoint, event.source.parent.endingPoint)

# Add the interval marker
event.source.chart.plot.addDomainMarker(IntervalMarker(startingPoint, endingPoint, system.gui.color(20, 10, 10, 40)))
Finally, run the necessary calculations on the mouse released event:
# If the mouse dragged event occured to create a marked area, run the calculations
if event.source.parent.endingPoint:
	# Reverse the starting and ending points if the mouse dragged event was from right to left
	startingPoint = min(event.source.parent.startingPoint, event.source.parent.endingPoint)
	endingPoint = max(event.source.parent.startingPoint, event.source.parent.endingPoint)

	# Calculate the min, max, and average for all values that correspond to dates that are within the marked interval
	data = event.source.Data
	headers = system.dataset.getColumnHeaders(data)
	startDate = system.date.fromMillis(int(startingPoint))
	endDate = system.date.fromMillis(int(endingPoint))
	for column in xrange(1, data.columnCount):
		header = headers[column]
		values = []
		for row in xrange(data.rowCount):
			if startDate <= data.getValueAt(row, 0) <= endDate:
				values.append(data.getValueAt(row, column))

		print startDate, ' to ', endDate
		print header, 'minValue:', min(values)
		print header, 'maxValue:', max(values)
		print header, 'avgValue:', sum(values) / len(values)
		print
Result:

Sample Output:
Fri Jun 28 04:53:53 CDT 2024  to  Sun Jun 30 10:53:32 CDT 2024
Process Temp minValue: 74
Process Temp maxValue: 114
Process Temp avgValue: 90

Fri Jun 28 04:53:53 CDT 2024  to  Sun Jun 30 10:53:32 CDT 2024
Output Temp minValue: 0
Output Temp maxValue: 16
Output Temp avgValue: 6
![]()

