We use XY charts frequently for pareto charts. We use the push method of supplying data so we no longer have the issue of data not showing up.
However I am still seeing this type of behavior especially on first load up:
If I simply click F5 to refresh the browser, everything goes to normal
What can we do about this?
Thanks,
Nick
Toobor
November 25, 2021, 10:02am
2
We have a similar problem:
When opening the view:
After refresh or after waiting a while (perhaps when the data is updated?):
We use Query binding as data source. When we visualize the data in a table the data is correct.
We are currently using Ignition 8.1.11 but we had the same problem in previuos versions.
tlovett
December 21, 2021, 6:51pm
3
I see the same problem on 8.1.12, a new data point can fix this or refreshing the webpage. Tried a query as a datasource, and then created a custom datasource for the view and still get the error.
We are using 8.1.17 now and I still see this same issue. We do not bind to the data sources, rather write to it like this:
	self.getChild("root").getChild("Data").getChild("Charts").getChild("ErrorPareto").\
		getChild("pareto").props.dataSources.pareto = pareto
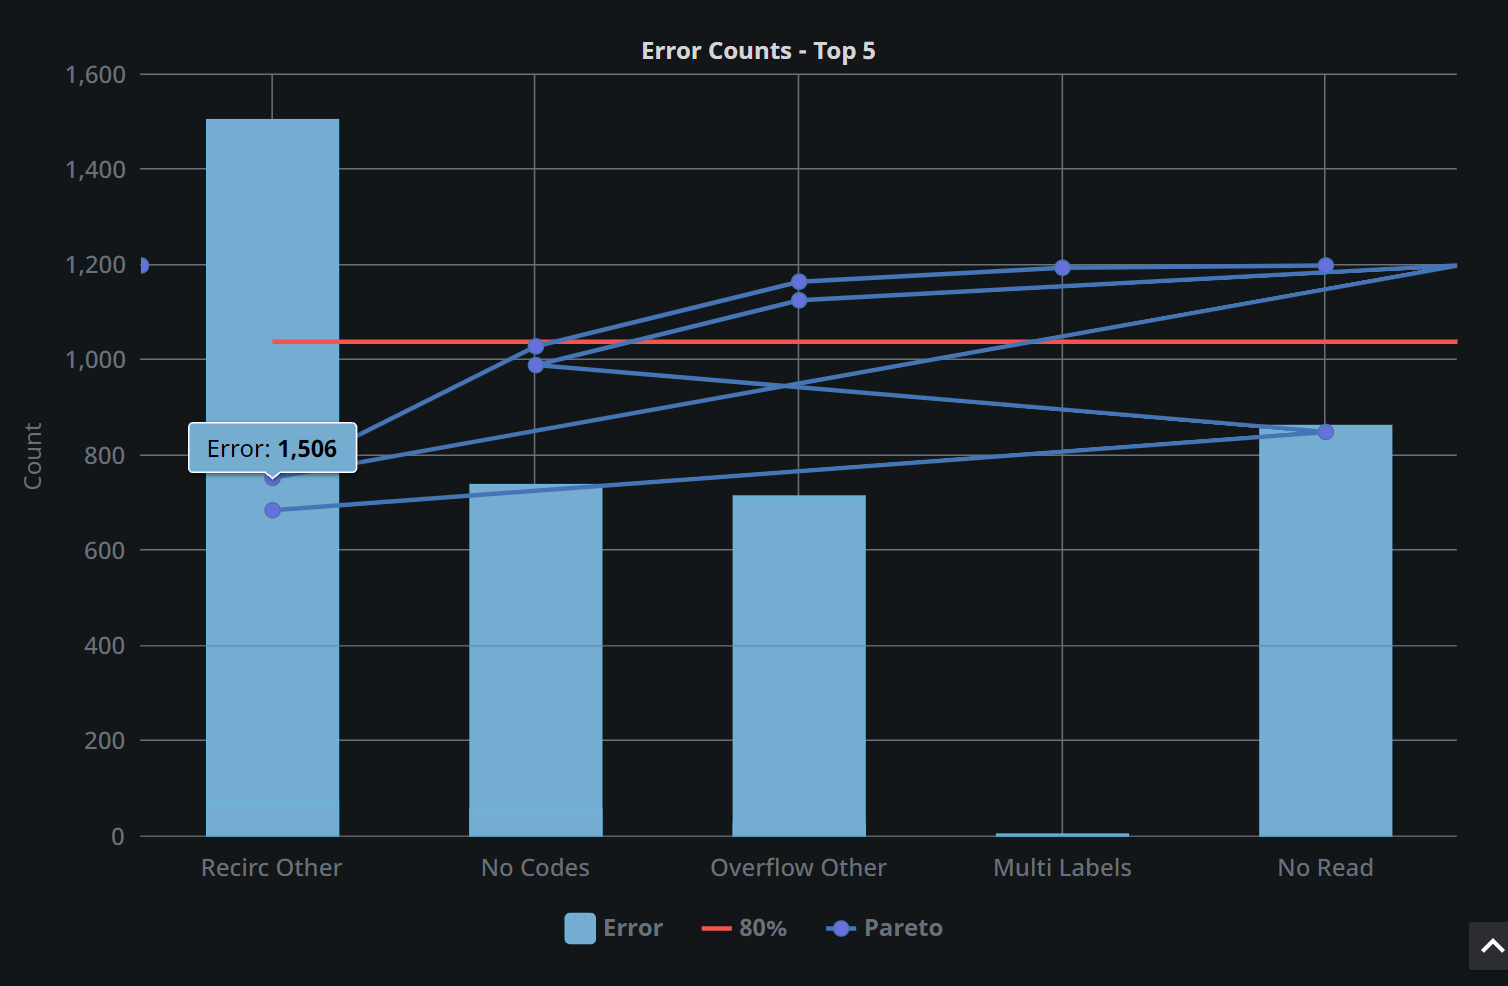
I don’t remember where but this was suggested to be a way to reduce issues however we still get funky stuff like this happening:
Thanks,
Nick
I brought up this issue here: XY Chart Not Updating with New Data
Haven’t heard anything since then.
@Joe_Kelly yeah, it seems like an issue that has been remaining for sometime.
I did submit a helpdesk ticket today since it wasn’t getting traction on the forum (its a relatively minor issue).
If I hear anything from that I would update this thread (or maybe IA will)?
Cheers,
Nick
I want to bring this item back to the top. We are using 8.1.19 now and I still see the same behavior.
Thanks,
Nick